Week 7 - Training with modeled frames
Meeting summary
- It has been possible to refactor the code for training and testing the networks with modeled images.
- With all this, it is possible to advance in training research with these new data.
- In addition, the generation of the two new types of dynamics, parabolic and sinusoidal is resumed.
- On the other hand, the possibility of adding a new error analysis is considered, comparing errors in general and in the two possible dimensions (x, y)
To Do
The tasks proposed for this week are
- Train and evaluate the networks with modeled data.
- Generate the datasets for the new dynamics: parabolic and sinusoidal.
- Modify the error info and graphs for a better analysis.
New error information
For a better analysis of the networks, the code has been modified so that the following information is obtained:
-
A new file with the target position, the predicted position, and the global absolute and relative errors for that sample are evaluated sample by sample.
Processed sample 0: Target position: [73 58] Position: [57 34] Error: 28.84 (20.0%) -------------------------------------------------------------- Processed sample 1: Target position: [ 4 29] Position: [32 71] Error: 50.48 (35.0%) -------------------------------------------------------------- Processed sample 2: Target position: [35 58] Position: [38 62] Error: 5.0 (3.47%) -------------------------------------------------------------- Processed sample 3: Target position: [79 87] Position: [50 44] Error: 51.87 (35.96%) -------------------------------------------------------------- Processed sample 4: Target position: [ 57 116] Position: [29 76] Error: 48.83 (33.85%) -------------------------------------------------------------- ... -
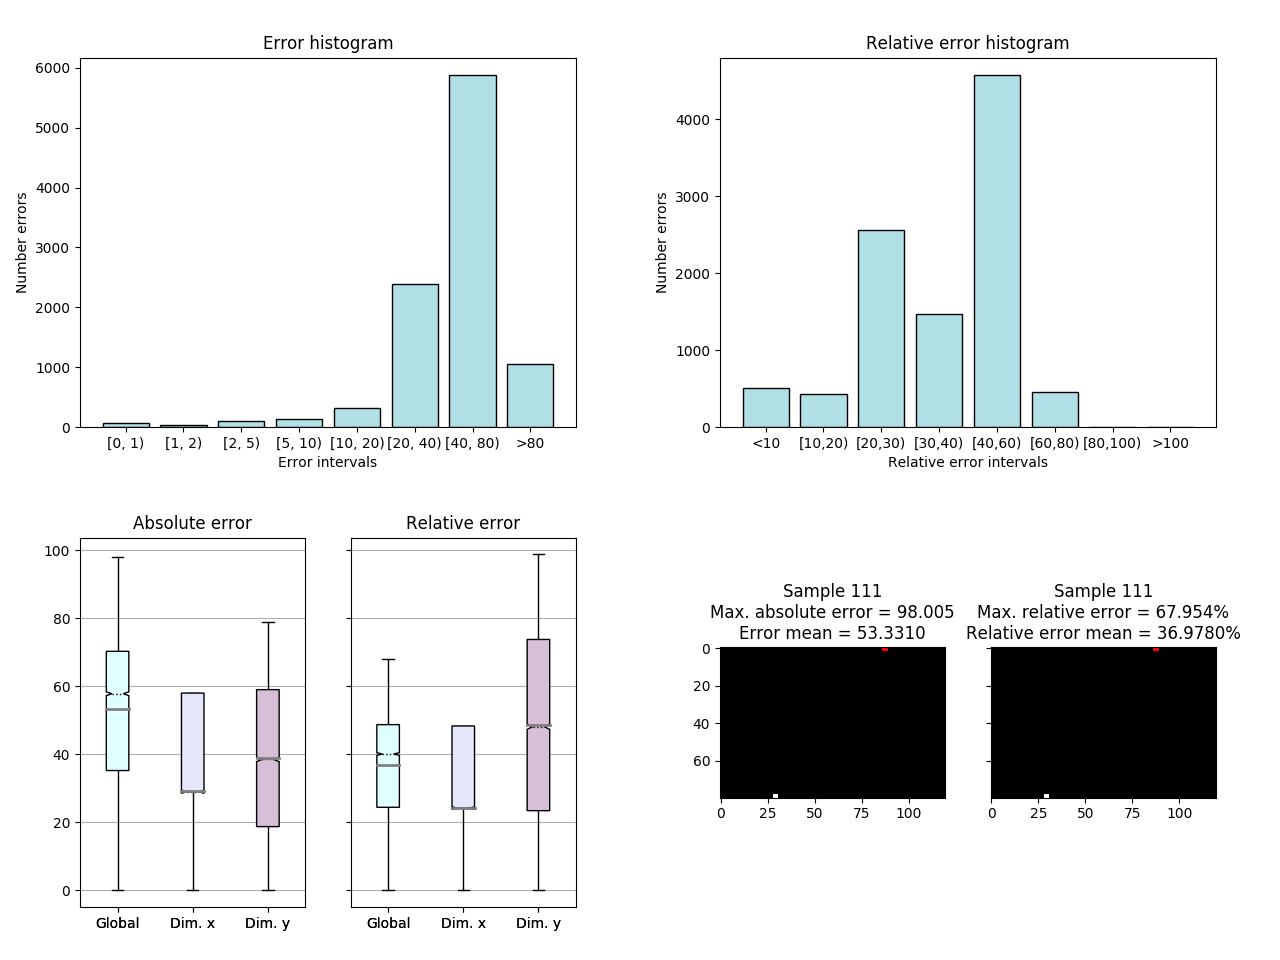
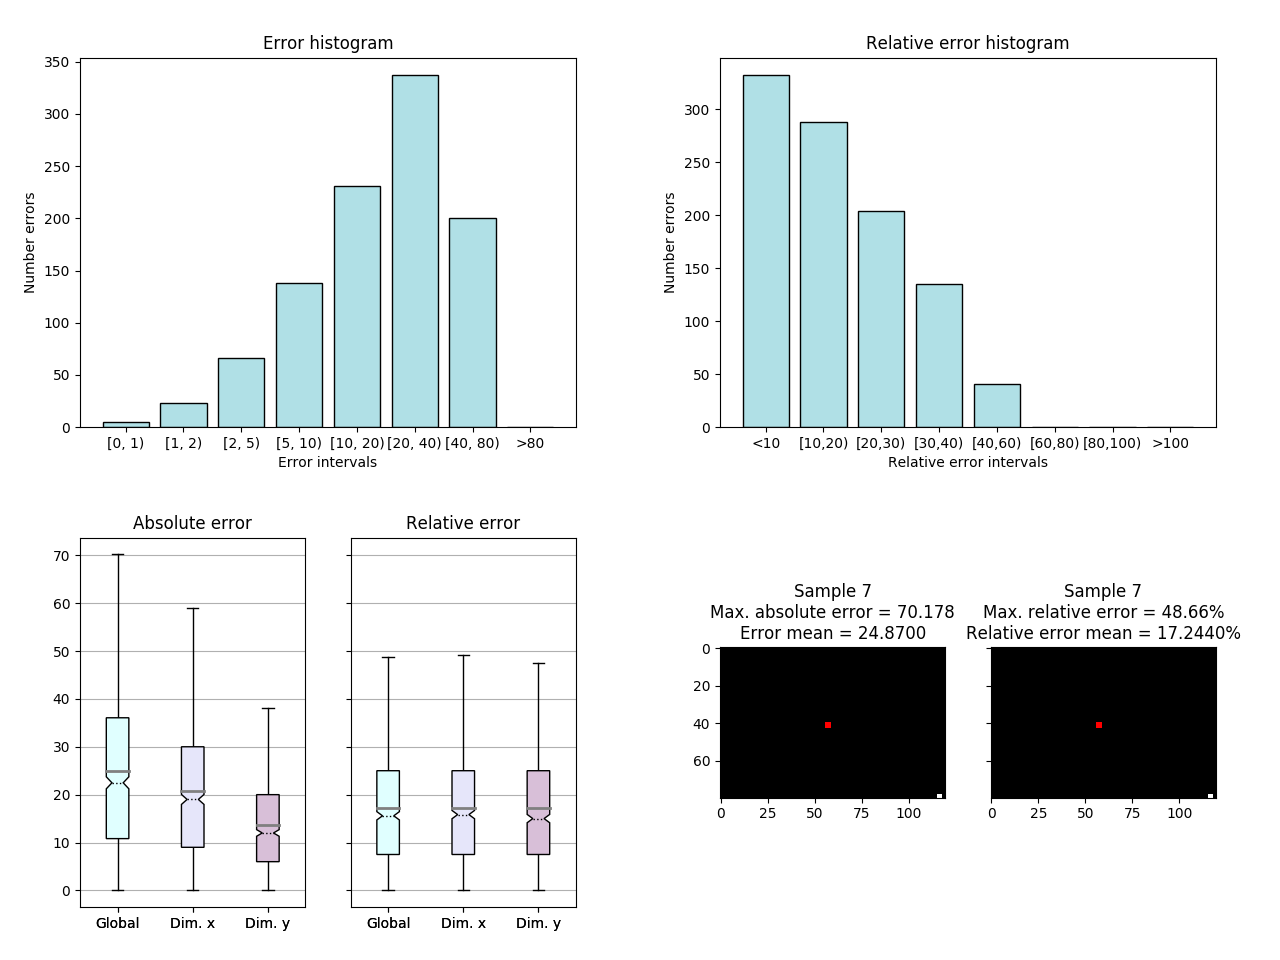
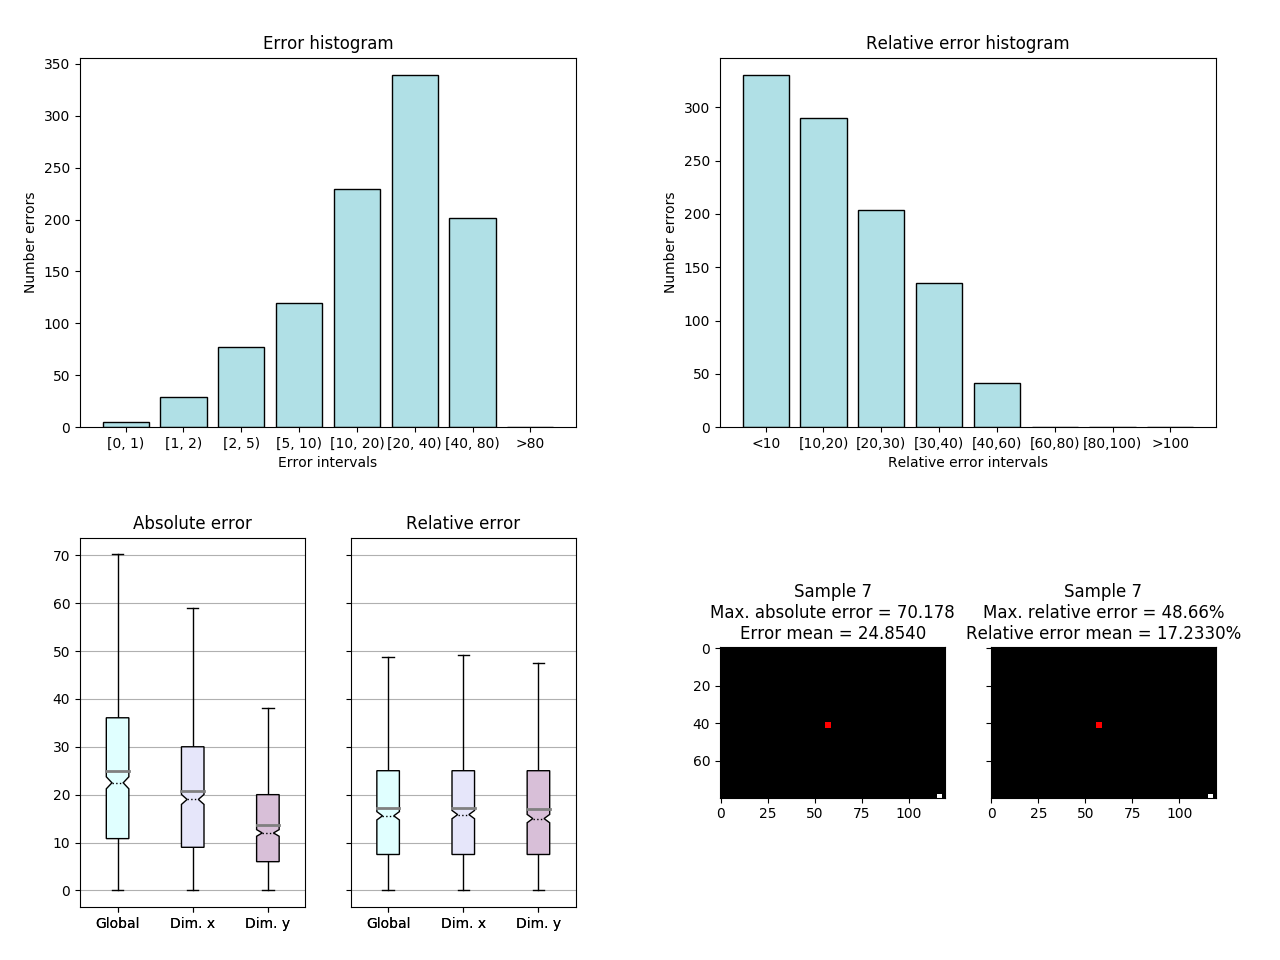
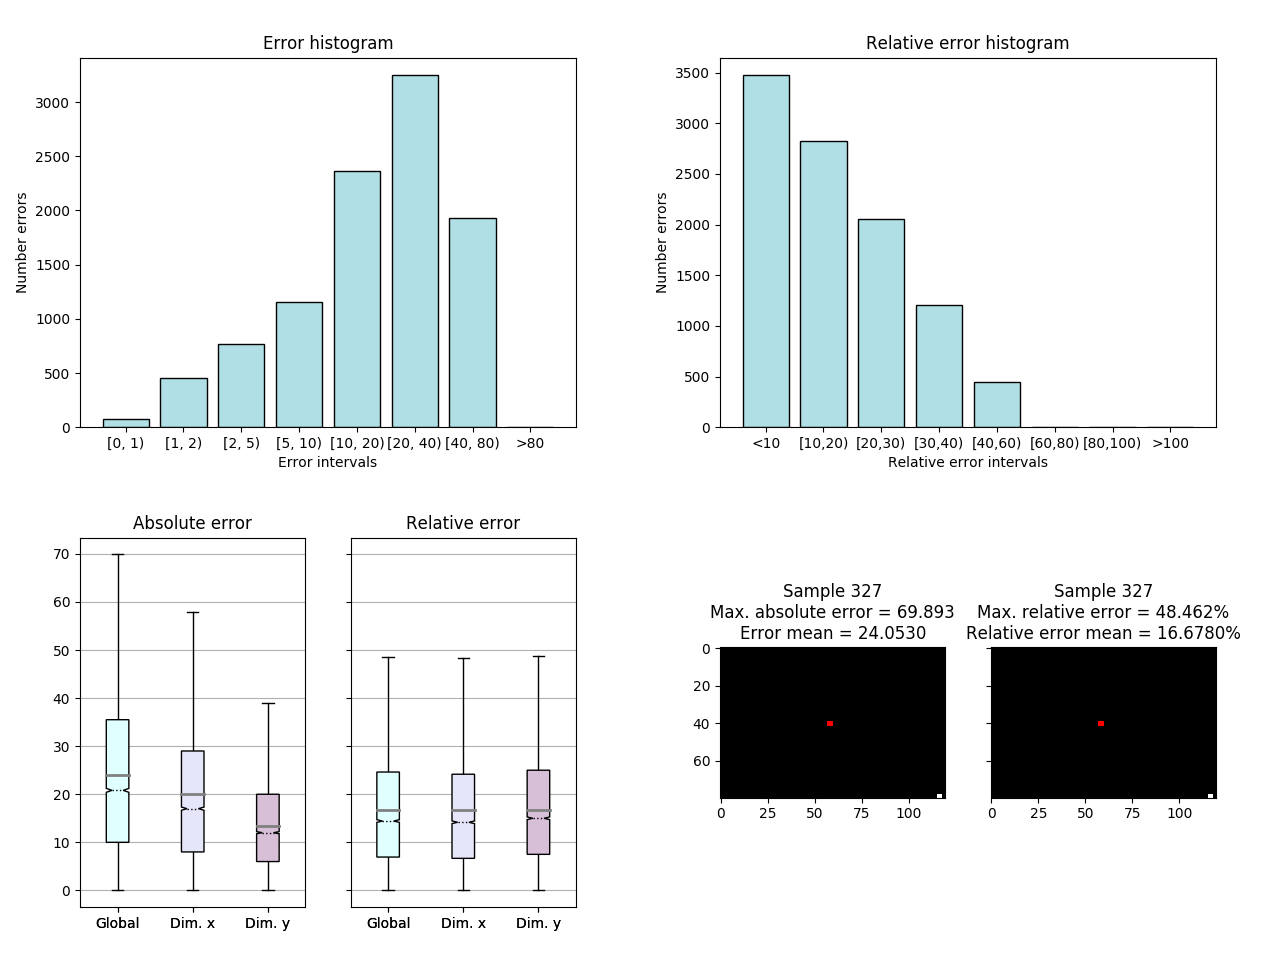
An image with four graphics with different information about the error obtained:
- An absolute global error histogram
- A relative global error histogram
- A series of boxplots showing breakdown error: global, x and y, absolute and relative.
- A summary of the global error with the sample that has produced the greatest error.
Training with modeled frames - Small dataset (10000 samples)
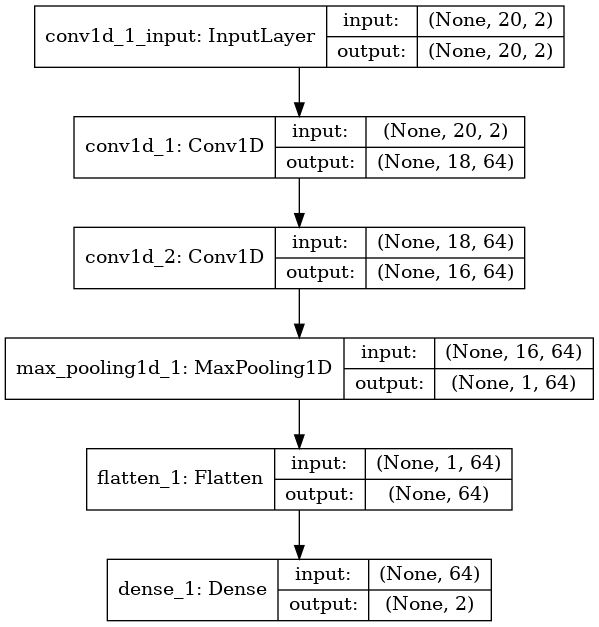
Non-Recurrent Network
I used the following structure:
In the next picture you can see a summary of the error committed
LSTM Network
I used the following structure:
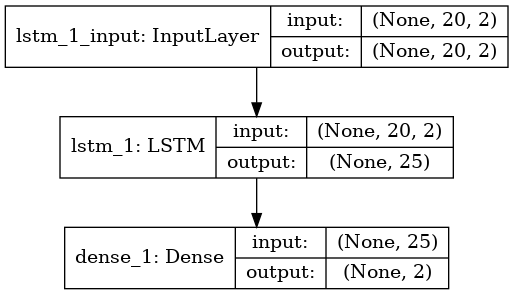
In the next picture you can see a summary of the error committed
Training with modeled frames - Big dataset (100000 samples)
Non-Recurrent Network
I used the following structure:
In the next picture you can see a summary of the error committed
LSTM Network
I used the following structure:

In the next picture you can see a summary of the error committed
Training with modeled frames - Conclusion
In view of the results obtained, which are far from what was expected, we could consider change the structure of these networks to improve the obtained result or analyze the different options in the activation and loss functions that may give better results.