Robotics URJC
Personal webpage for TFM Students.
View the Project on GitHub RoboticsLabURJC/2017-tfm-vanessa-fernandez
Week 12: Follow line with classification network, Studying Tensorboard, Classification network for v, Regression network for w and v
Follow line with classification network and with regression network
I’ve used the predictions of the classification network according to w (7 classes) to pilot a formula 1. Depending on the class of w, a different angle of rotation is given to the vehicle and the linear speed remains constant. With this network part of the circuit is achieved, but the car crashes when leaving a curve. Below, you can see an example:
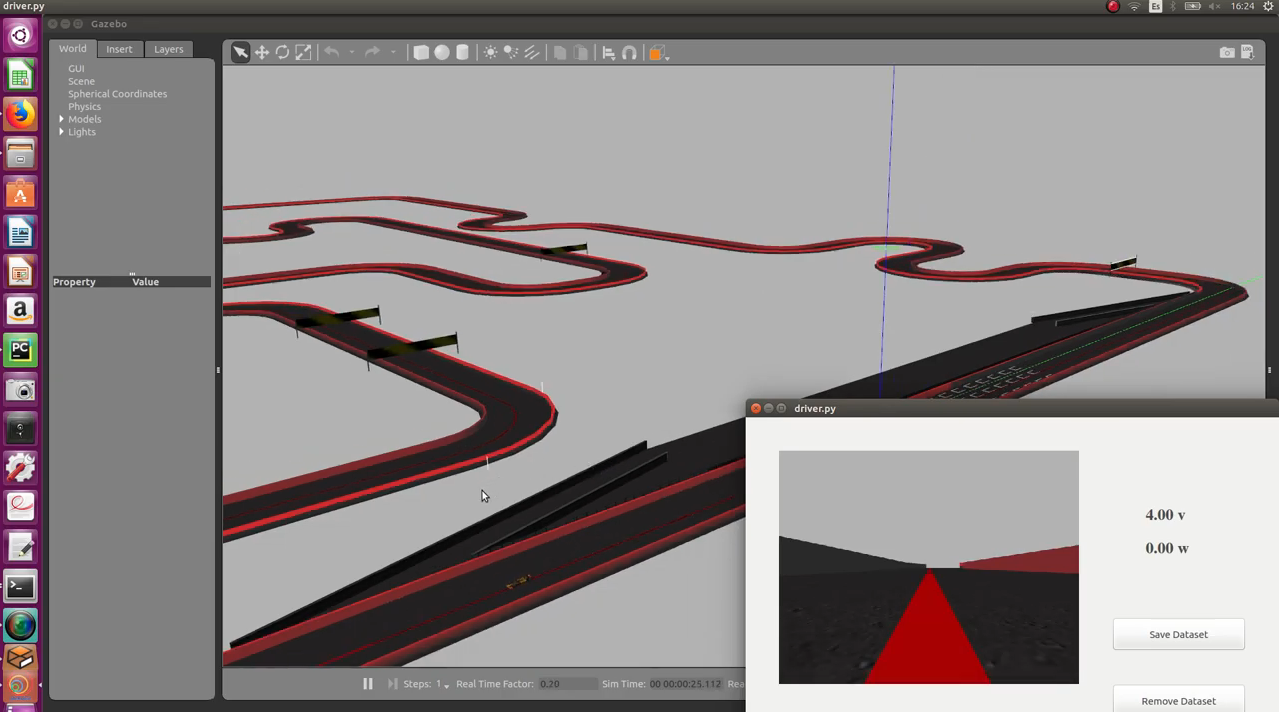
I’ve used the predictions of the classification network according to w (7 classes) and v (4 classes) to pilot a formula 1. Depending on the class of w, a different angle of rotation is given to the vehicle and depending on the class of v, a different linear speed is given to the vehicle. With this network part of the circuit is achieved, but the car crashes when leaving a curve. Below, you can see an example:
I’ve used the predictions of the regression network to drive a formula 1 (223 epochs for v and 212 epochs for w):
Studying Tensorboard
Tensorboard is a suite of visualization tools that makes it easier to understand, debug, and optimize TensorFlow programs. You can use TensorBoard to visualize your TensorFlow graph, plot quantitative metrics about the execution of your graph, and show additional data like images that pass through it. Tensorboard can also be used with Keras. I’ve followed some tutorials: 1, 2, 3.
Tensorboard is a separate tool you need to install on your computer. You can install Tensorboard using pip the python package manager:
pip install Tensorboard
To use Tensorboard you have to modify the Keras code a bit. You need to create a new TensorBoard instance and point it to a log directory where data should be collected. Next you need to modify the fit call so that it includes the tensorboard callback.
from time import time
from keras.callbacks import TensorBoard

tensorboard = TensorBoard(log_dir="logs/{}".format(time()))
model.fit(X_train, y_train, epochs=nb_epochs, batch_size=batch_size, callbacks=[tensorboard])
We can pass different arguments to the callback:
-
log_dir: the path of the directory where to save the log files to be parsed by TensorBoard.
-
histogram_freq: frequency (in epochs) at which to compute activation and weight histograms for the layers of the model. If set to 0, histograms won’t be computed. Validation data (or split) must be specified for histogram visualizations.
-
write_graph: whether to visualize the graph in TensorBoard. The log file can become quite large when write_graph is set to True.
-
write_grads: whether to visualize gradient histograms in TensorBoard. histogram_freq must be greater than 0.
-
batch_size: size of batch of inputs to feed to the network for histograms computation.
-
write_images: whether to write model weights to visualize as image in TensorBoard.
-
embeddings_freq: frequency (in epochs) at which selected embedding layers will be saved. If set to 0, embeddings won’t be computed. Data to be visualized in TensorBoard’s Embedding tab must be passed as embeddings_data.
-
embeddings_layer_names: a list of names of layers to keep eye on. If None or empty list all the embedding layer will be watched.
-
embeddings_metadata: a dictionary which maps layer name to a file name in which metadata for this embedding layer is saved. In case if the same metadata file is used for all embedding layers, string can be passed.
-
embeddings_data: data to be embedded at layers specified in embeddings_layer_names. Numpy array (if the model has a single input) or list of Numpy arrays (if the model has multiple inputs).
The callback raises a ValueError if histogram_freq is set and no validation data is provided. Using Tensorboard callback will work while eager execution is enabled, however outputting histogram summaries of weights and gradients is not supported, and thus histogram_freq will be ignored.
To run TensorBoard, use the following command:
tensorboard --logdir=path/to/log-directory
where logdir points to the directory where the FileWriter serialized its data. If this logdir directory contains subdirectories which contain serialized data from separate runs, then TensorBoard will visualize the data from all of those runs. For example, in our
tensorboard --logdir=logs/
Once TensorBoard is running, navigate your web browser to localhost:6006 to view the TensorBoard. When looking at TensorBoard, you will see the navigation tabs in the top right corner. Each tab represents a set of serialized data that can be visualized.
Tensorboard has different views which take inputs of different formats and display them differently. You can change them on the orange top bar. Different views of Tensorboard are:
-
Scalars: Visualize scalar values, such as classification accuracy.
-
Graph: Visualize the computational graph of your model, such as the neural network model.
-
Distributions: Visualize how data changes over time, such as the weights of a neural network.
-
Histograms: A fancier view of the distribution that shows distributions in a 3-dimensional perspective.
-
Projector: Can be used to visualize word embeddings (that is, word embeddings are numerical representations of words that capture their semantic relationships).
-
Image: Visualizing image data.
-
Audio: Visualizing audio data.
-
Text: Visualizing text (string) data.
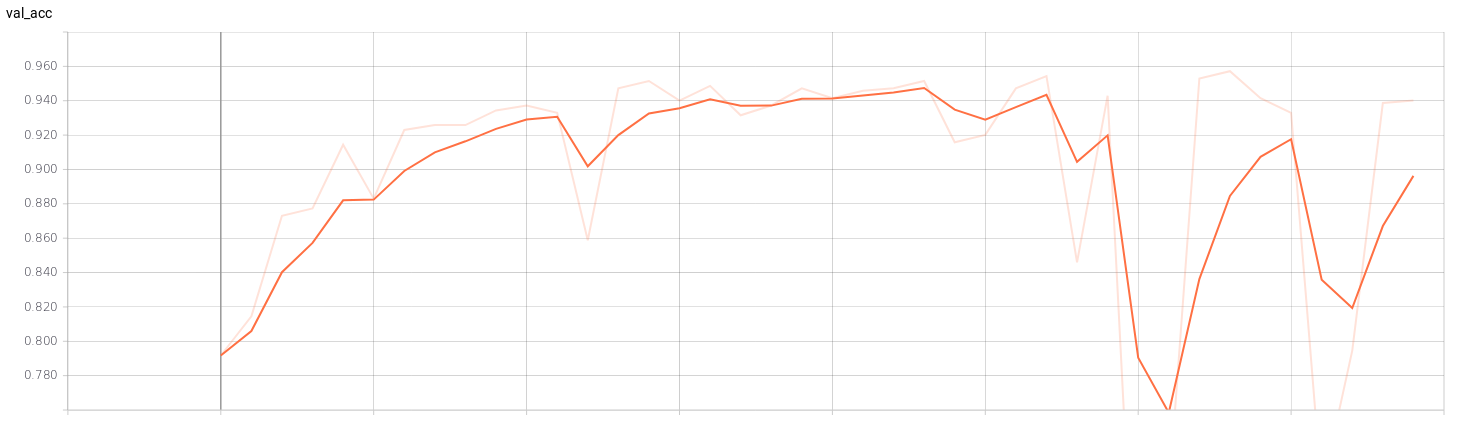
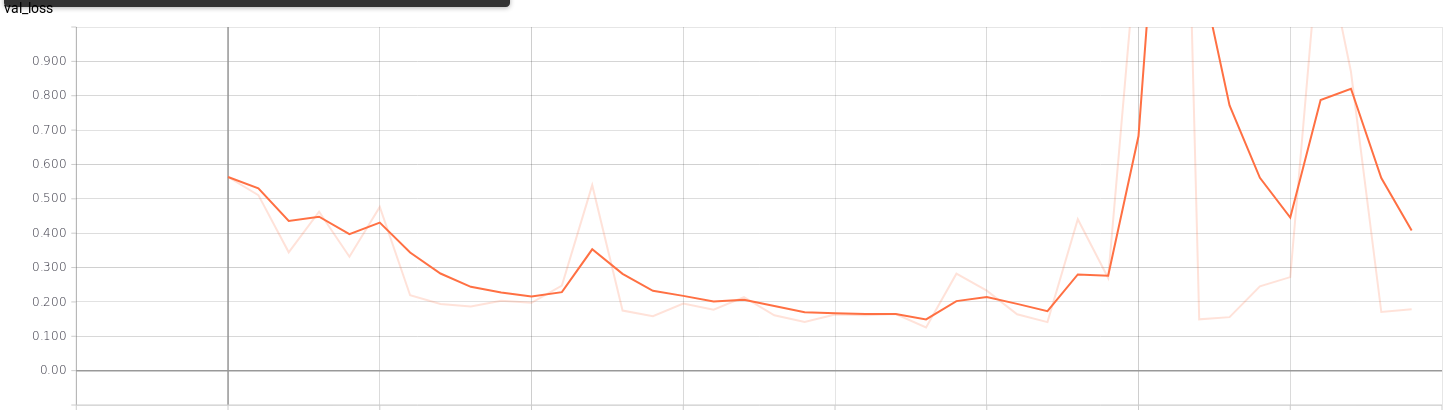
If we see the graphs of the training we can check when our model is being overfitting. For example, in a training of a classification model (4 classes) with a batch_size of 32 and an epochs of 40 we can see the point where the training stops being efficient. In the graphs of the validation set we can see that from epochs 23 training is no longer efficient.
Classification network for v
The files data.json, train.json and test.json have been modified to add a new classification that divides the linear speed into 4 classes. The classes are the following:
slow: if the linear speed is v <= 7.
moderate: if the linear speed is v > 7 and v <= 9.
fast: if the linear speed is v > 9 and v <= 11.
very_fast: if the linear speed is v > 11.
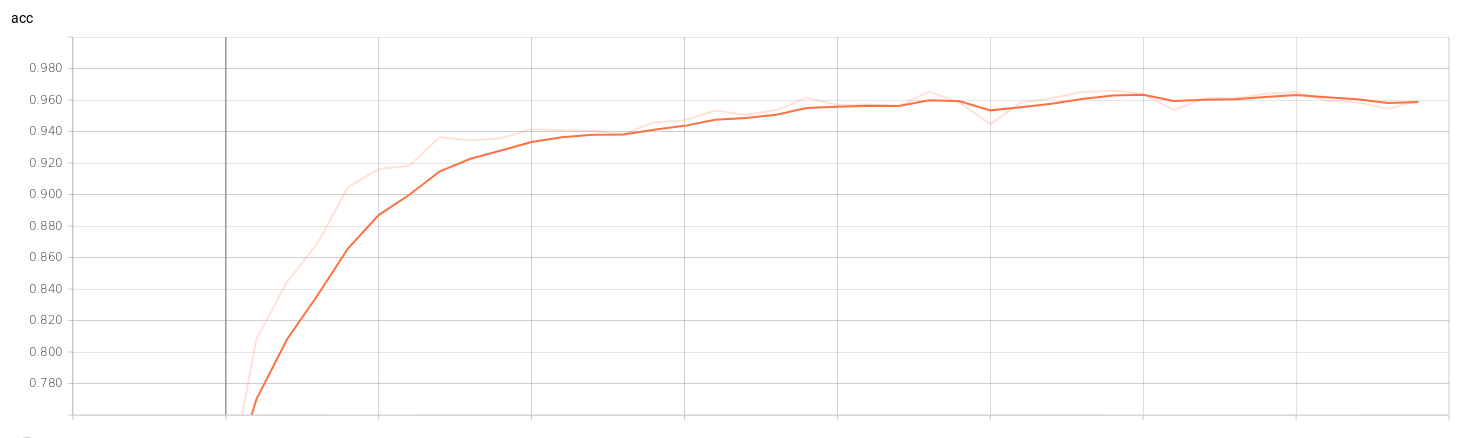
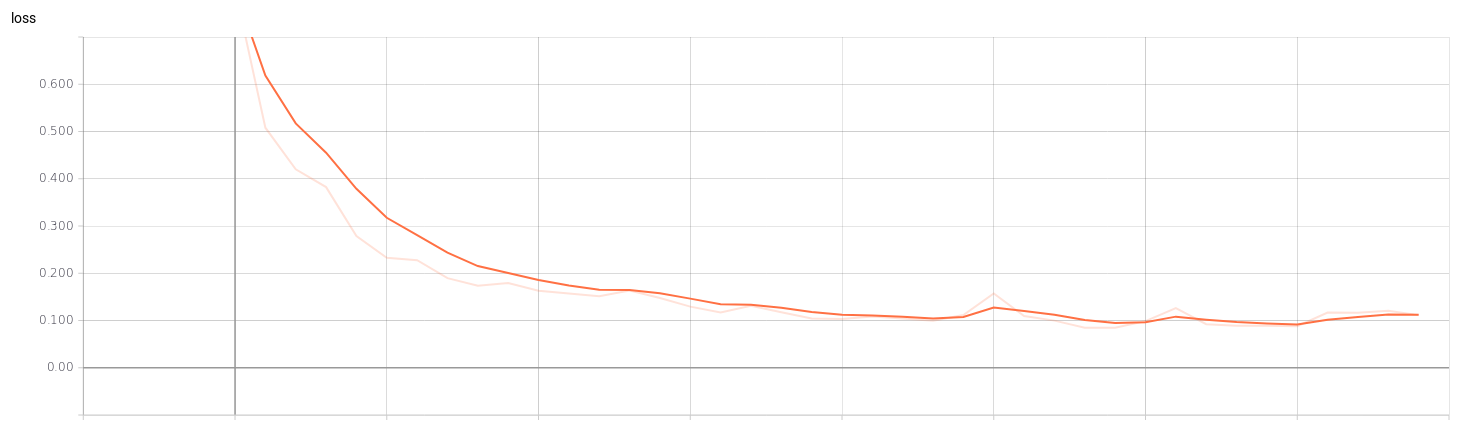
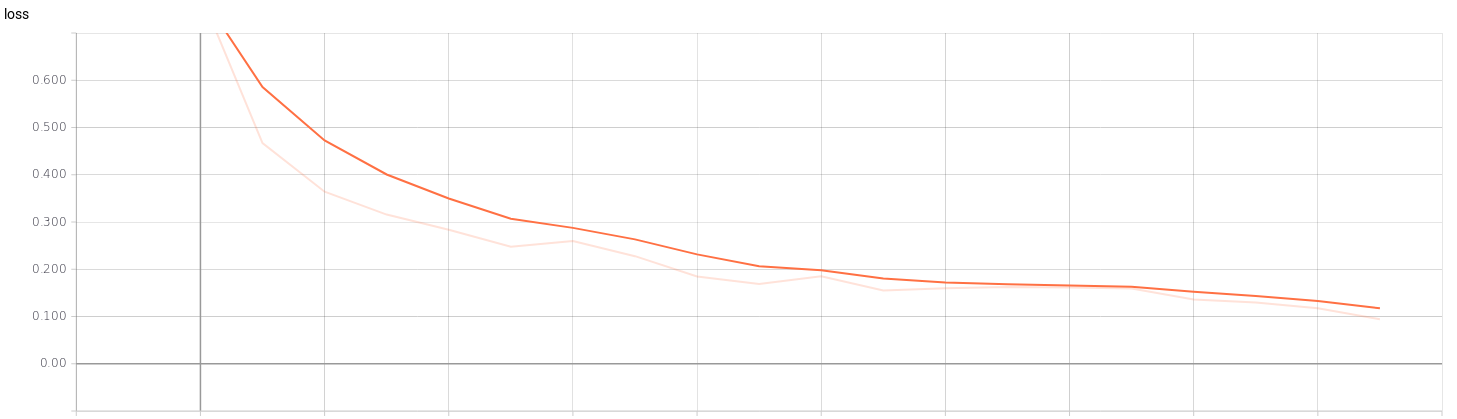
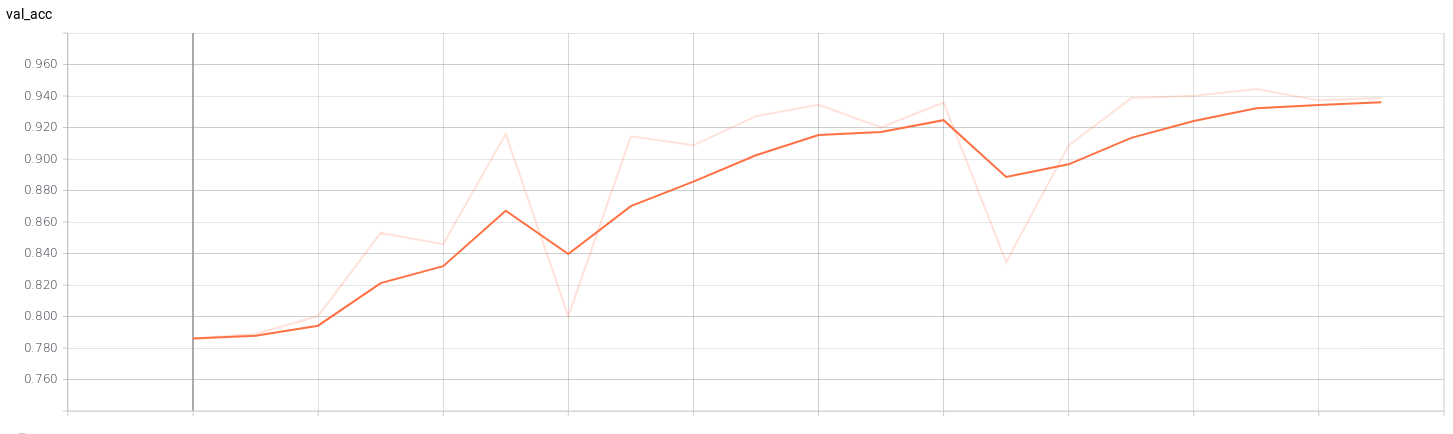
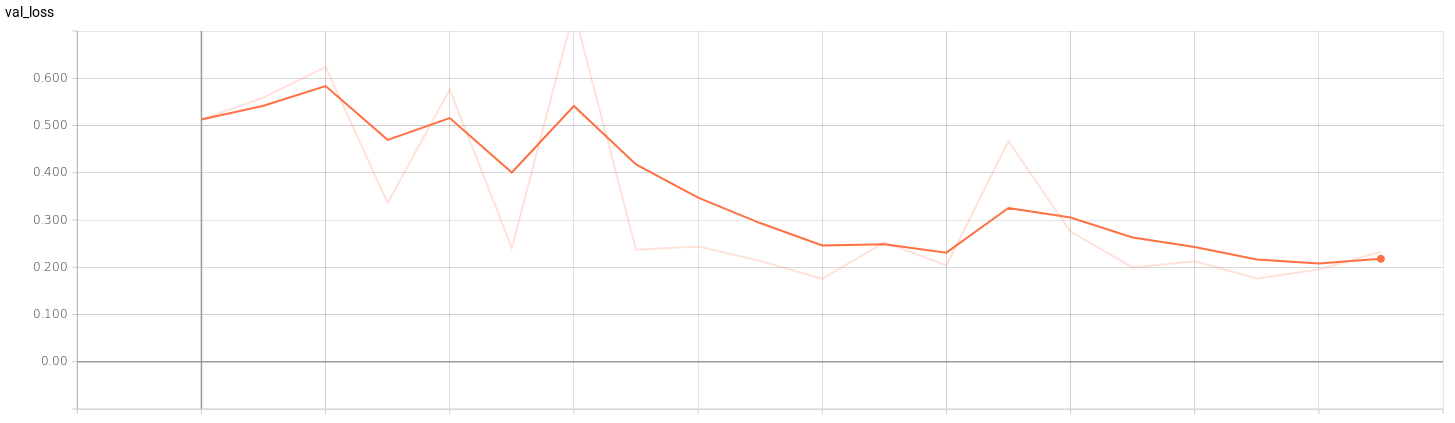
I’ve trained a model with the 4 classes mentioned above. The CNN architecture I am using is SmallerVGGNet, a simplified version of VGGNet. After training the network, we save the model (models/model_smaller_vgg_4classes_v.h5) and show the graphs of loss and accuracy for training and validation according to the epochs. For that, I’ve used Tensorboard:
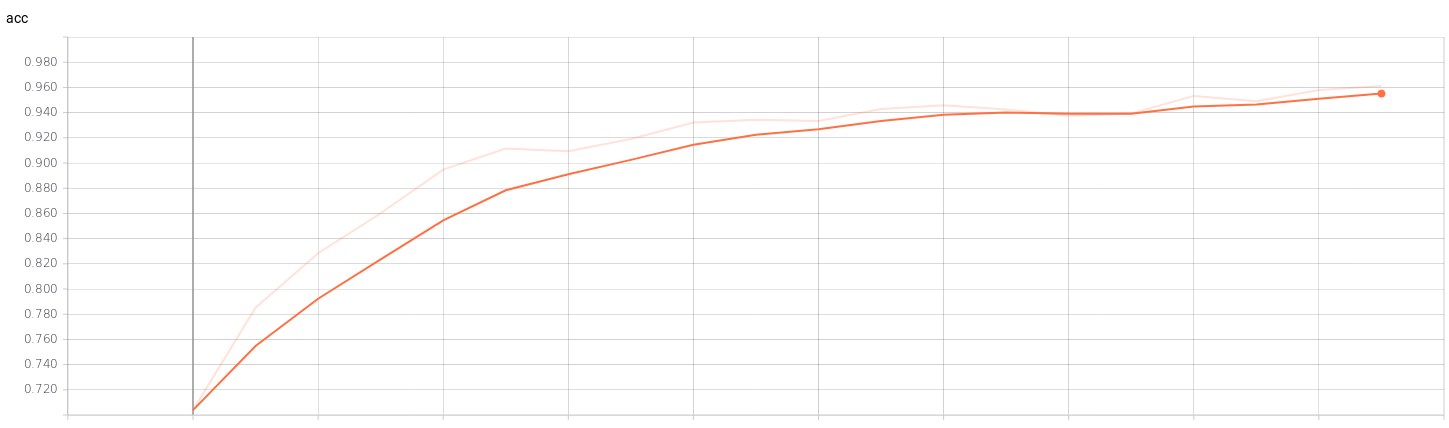
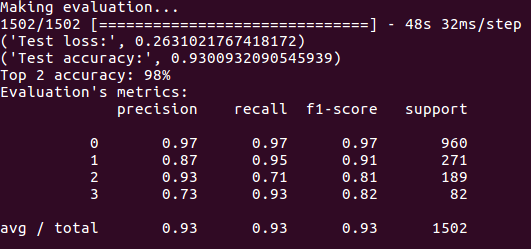
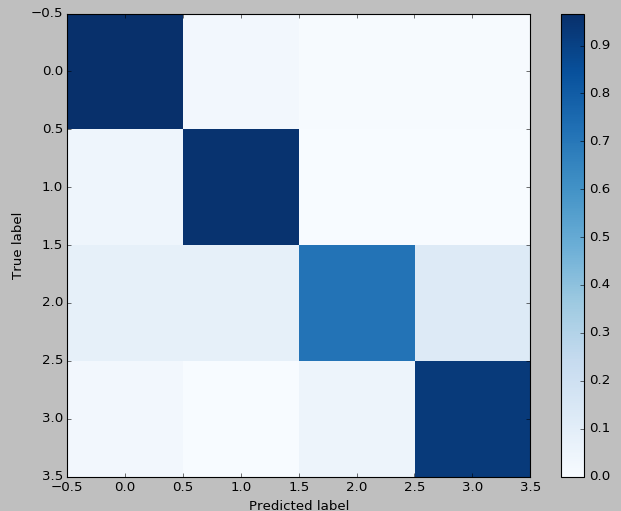
In addition, I evaluate the accuracy, precision, recall, F1-score (in test set) and we paint the confusion matrix. The results are the following:
Regression network for w and v
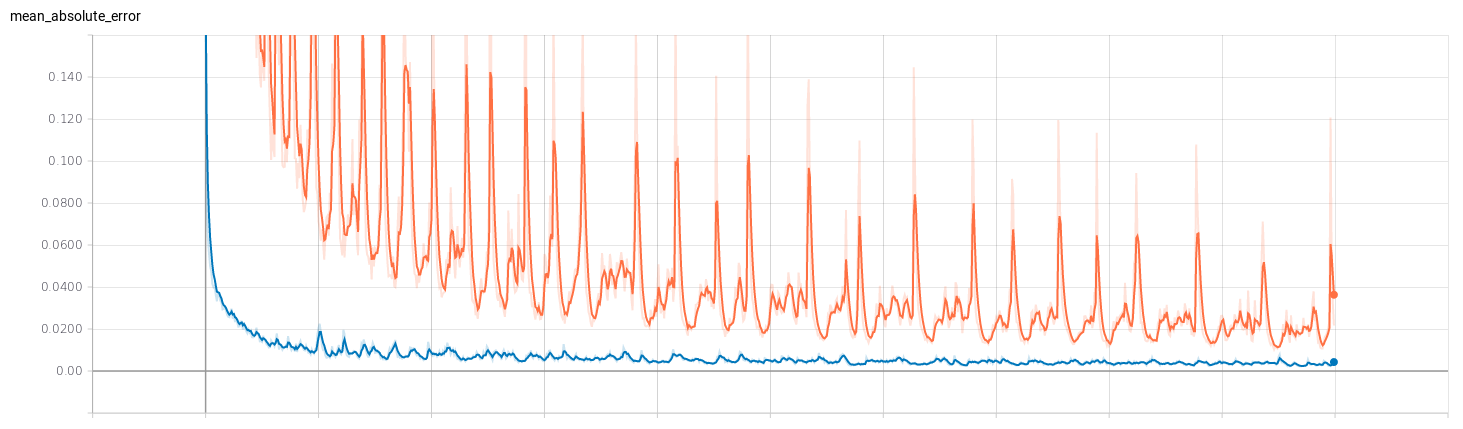
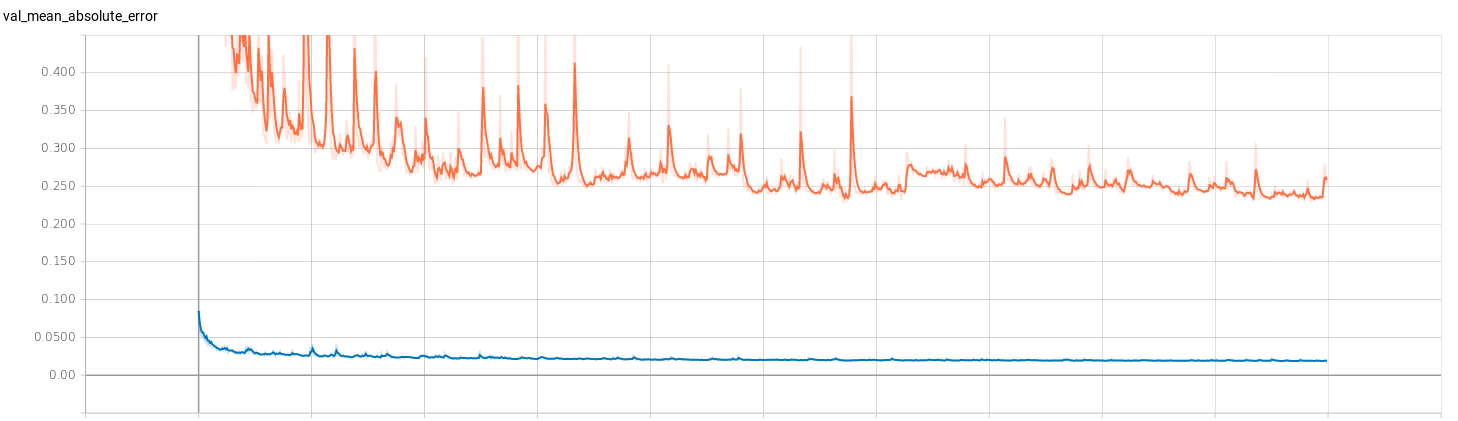
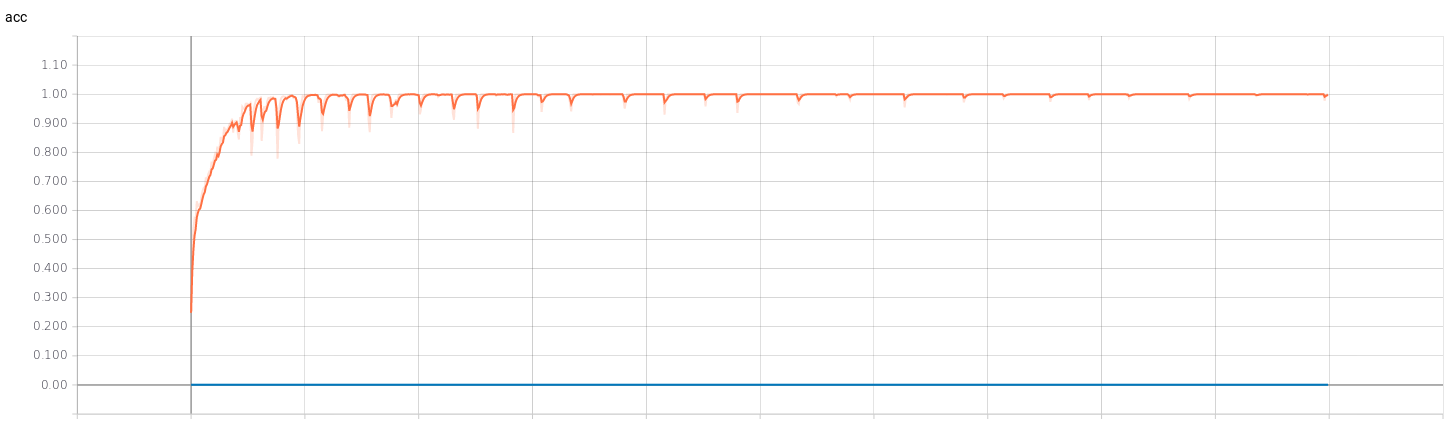
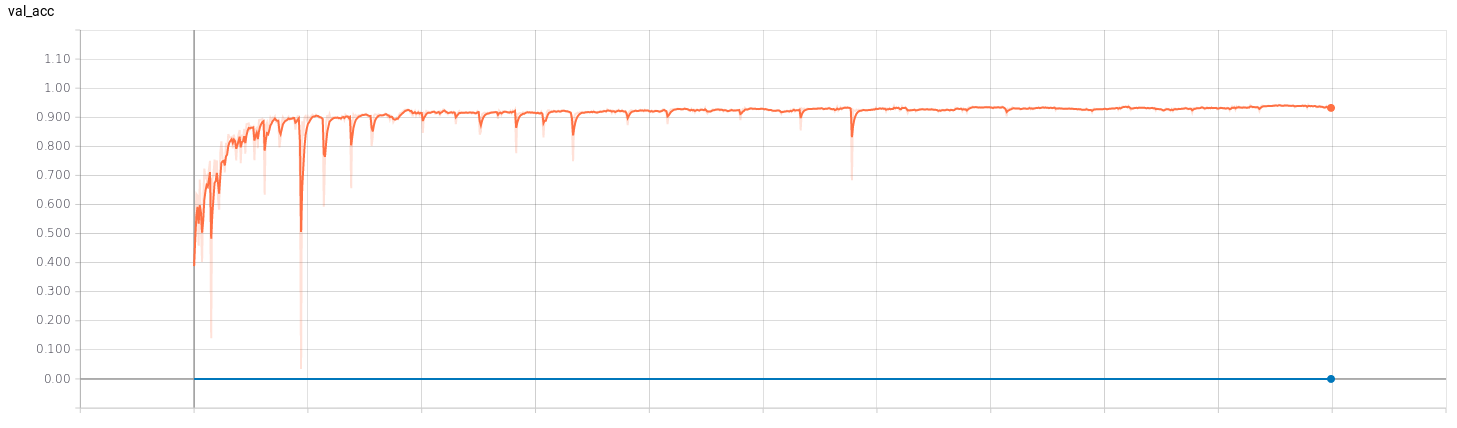
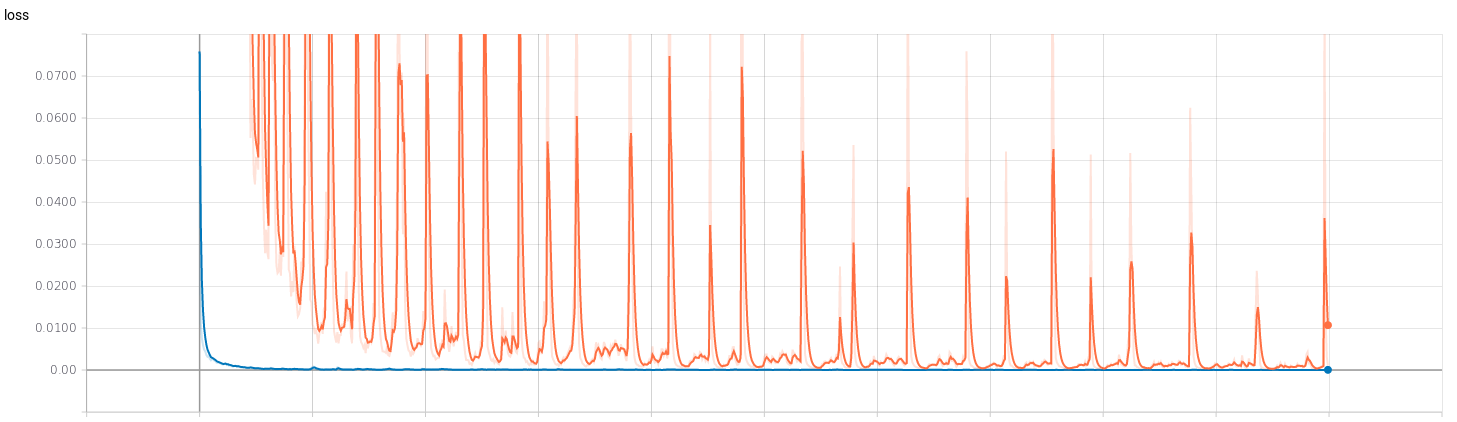
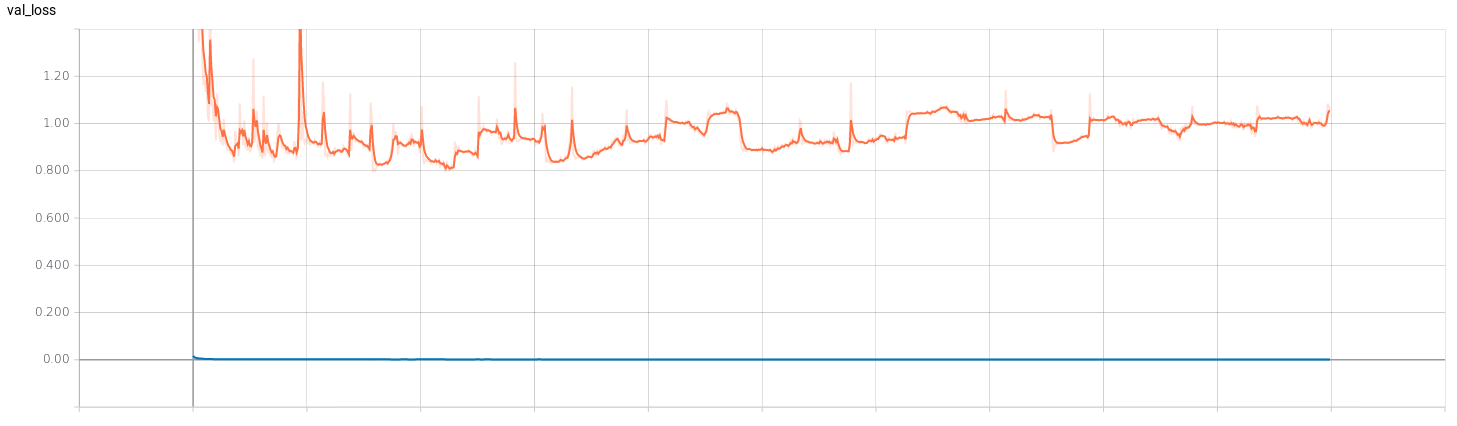
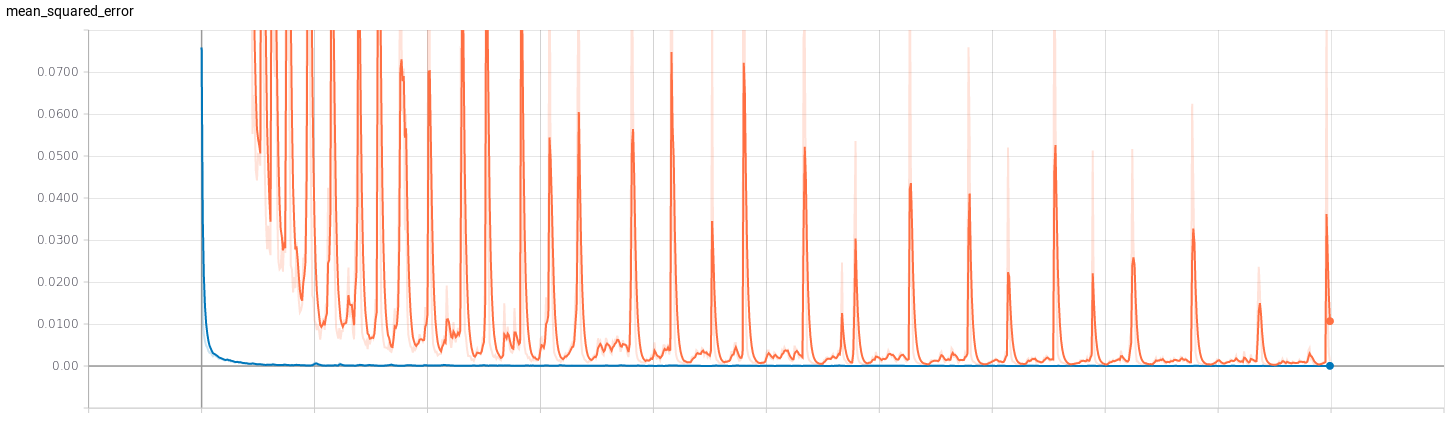
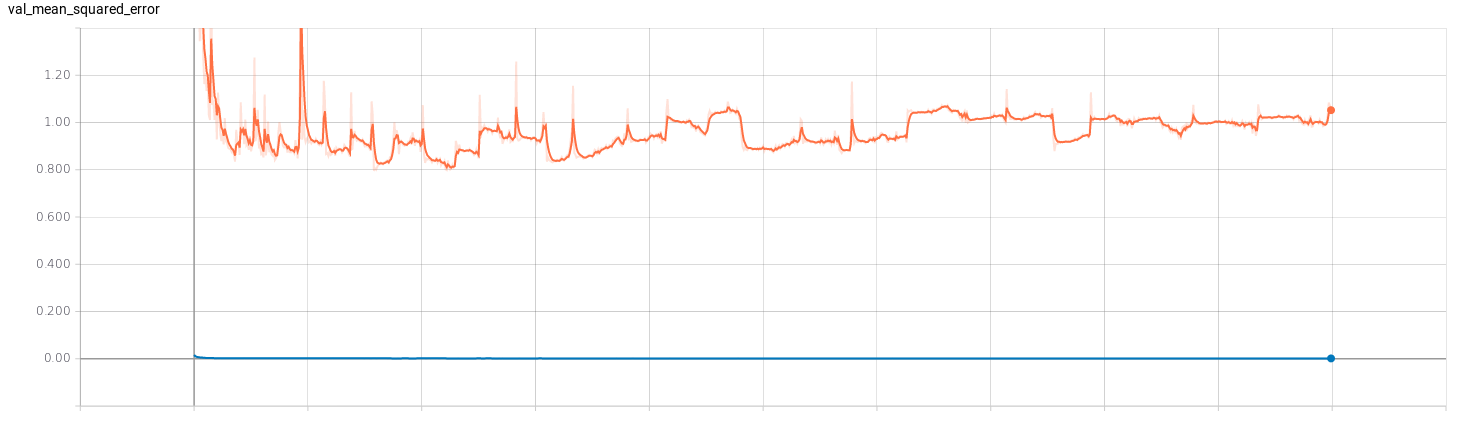
I’ve trained two regression networks (for v and for w) following the Pilotnet architecture. To get an idea of the efficiency of the training I’ve used Tensorboard. I’ve trained both networks with 1000 epochs to see how they behaved. The results can be seen below, where the red curve represents the model of v and the blue curve represents the model of w.
- Accuracy:
- Loss:
- Mean squared error:
- Mean absolute error: