Robotics URJC
Personal webpage for TFM Students.
View the Project on GitHub RoboticsLabURJC/2017-tfm-vanessa-fernandez
Week 14: Classification Network, Regression Network, Reading information
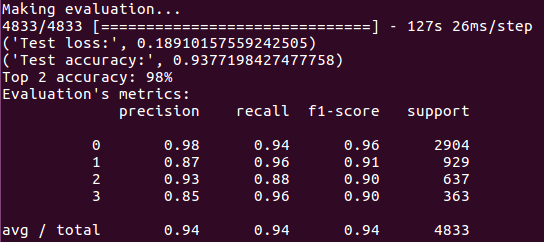
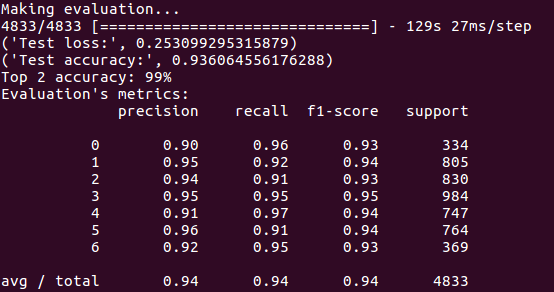
This week, I’ve retrained the models with the new dataset. This new dataset is divided into 11275 pairs of images and speed data for training, and 4833 pairs of images and data for testing.
Driving videos
I’ve used the predictions of the classification network according to w (7 classes) and v (4 classes) to driving a formula 1:
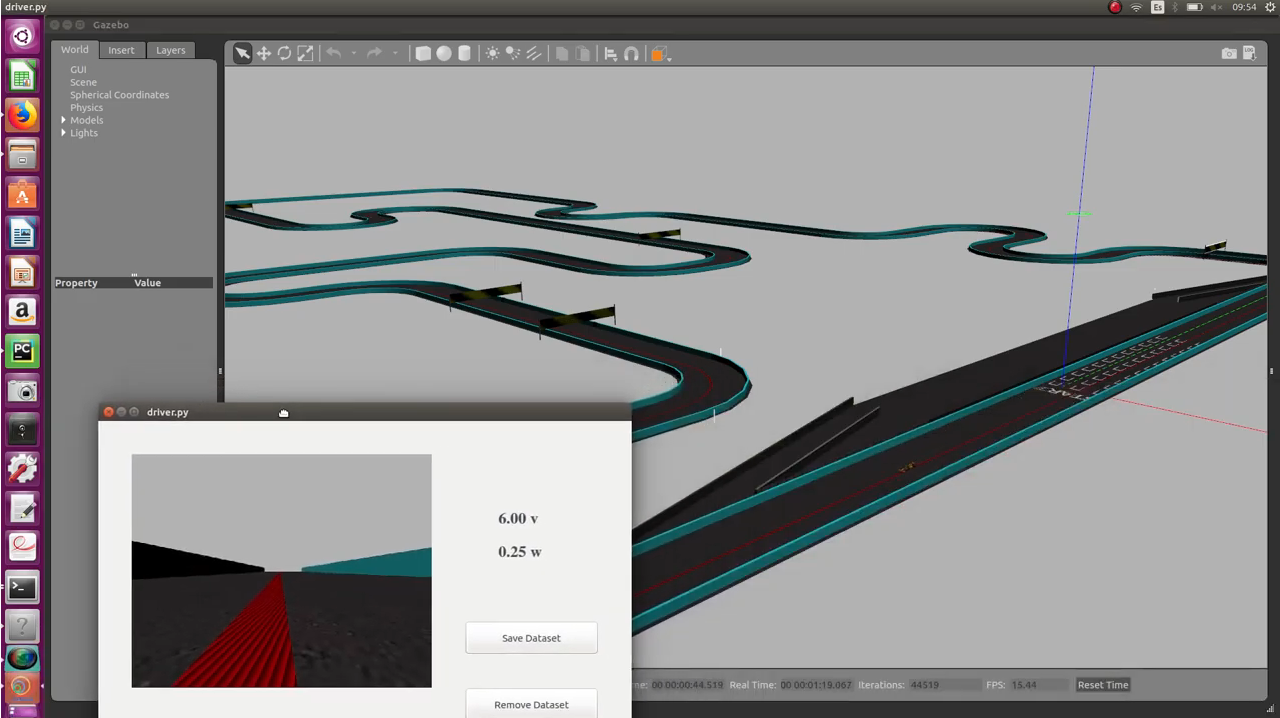
I’ve used the predictions of the regression network (223 epochs for v and 212 for w) to driving a formula 1:
Data statistics
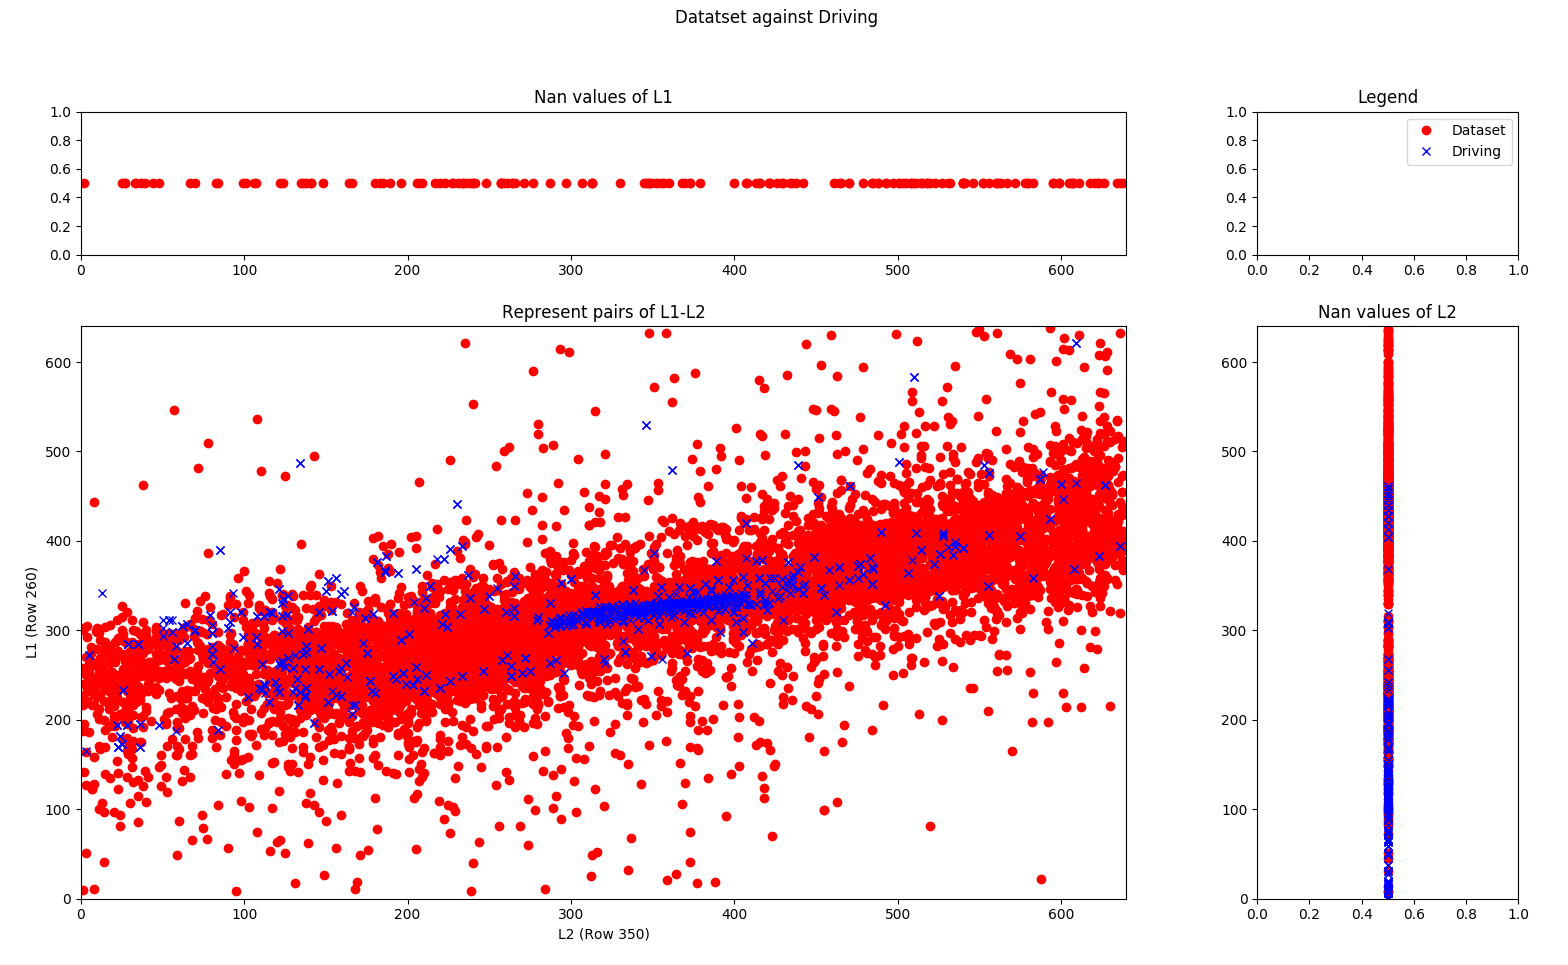
To analyze the data, a new statistic was created (analysis_vectors.py). I’ve analyzed two lines of each image and calculated the centroids of the corresponding lines (row 250 and row 360). On the x-axis of the graph, the centroid of row 350 is represented and the y-axis represents the centroid of row 260 of the image. In the following image we can see the representation of this statistic of the training set (new dataset) (red circles) iagainst the driving data (blue crosses).
Reading information
I’ve read some information about self-driving. I’ve read about different architectures:
-
TinyPilotNet: developed as a reduction from NVIDIA PilotNet CNN.
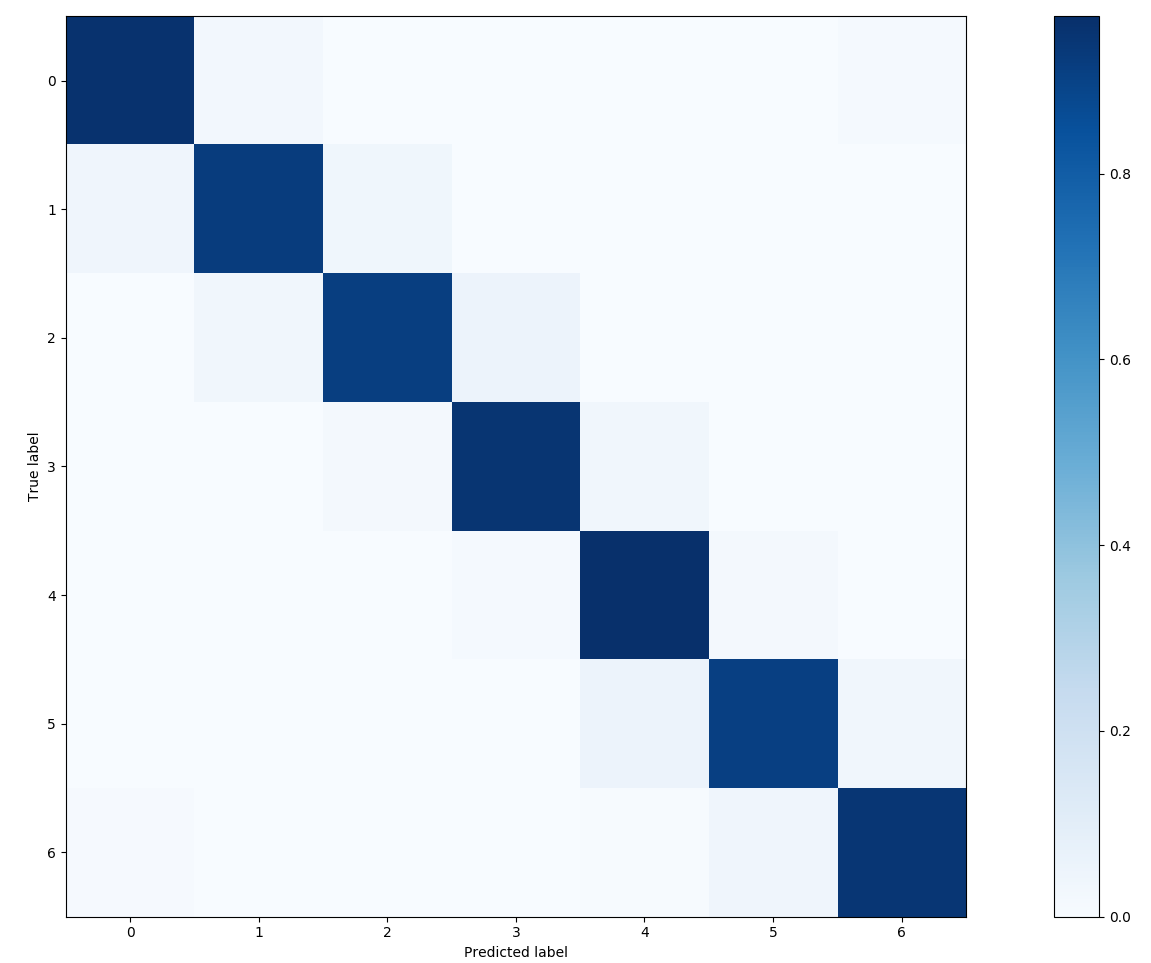
Classification network for w
I’ve retrained the classification network for w with the new dataset. The test results are:
Classification network for v
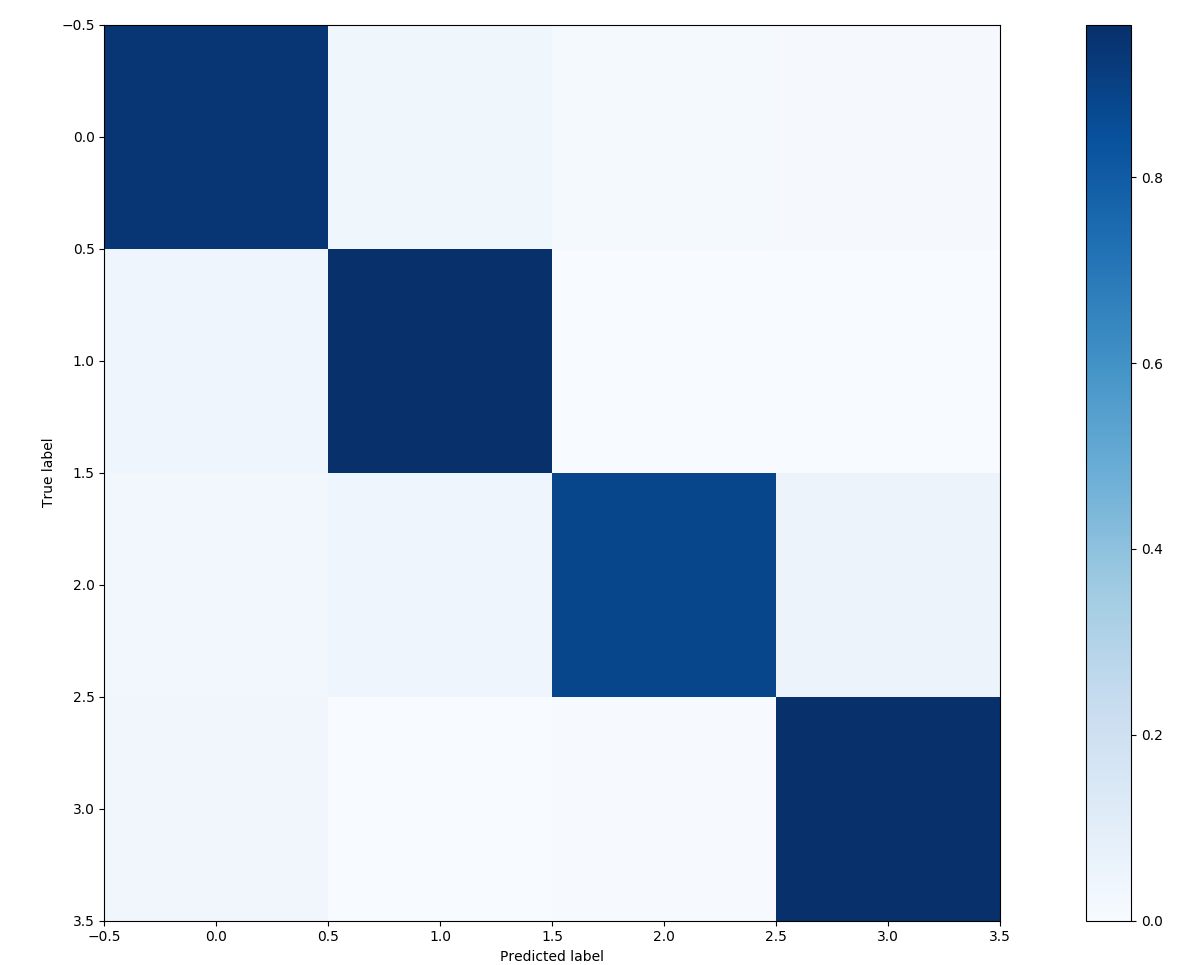
I’ve retrained the classification network for v with the new dataset. The test results are: