Robotics URJC
Personal webpage for TFM Students.
View the Project on GitHub RoboticsLabURJC/2017-tfm-vanessa-fernandez
Week 15: Driving videos, Dataset coherence study, Driving analysis, New gui
Driving videos
I’ve used the predictions of the classification network according to w (7 classes) and v constant to driving a formula 1:
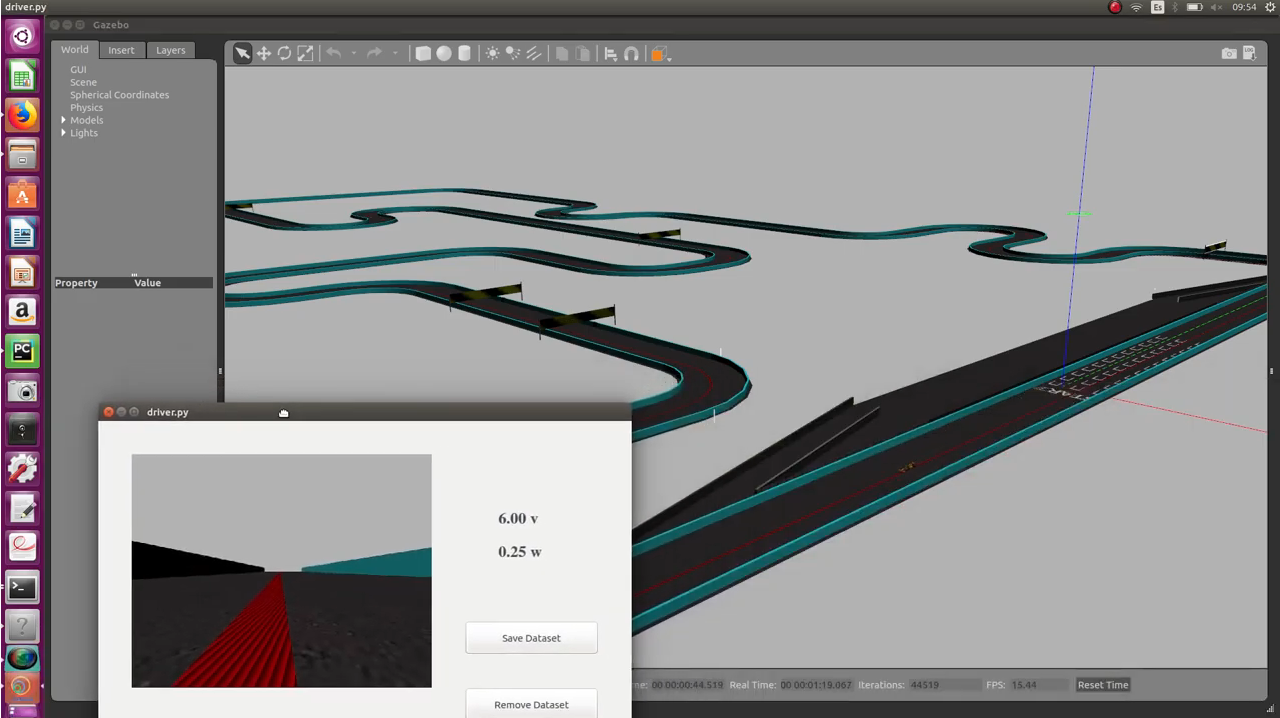
I’ve used the predictions of the classification network according to w (7 classes) and v (4 classes) to driving a formula 1:
I’ve used the predictions of the regression network for w and constant v to driving a formula 1:
I’ve used the predictions of the regression network for w and v to driving a formula 1:
Dataset coherence study
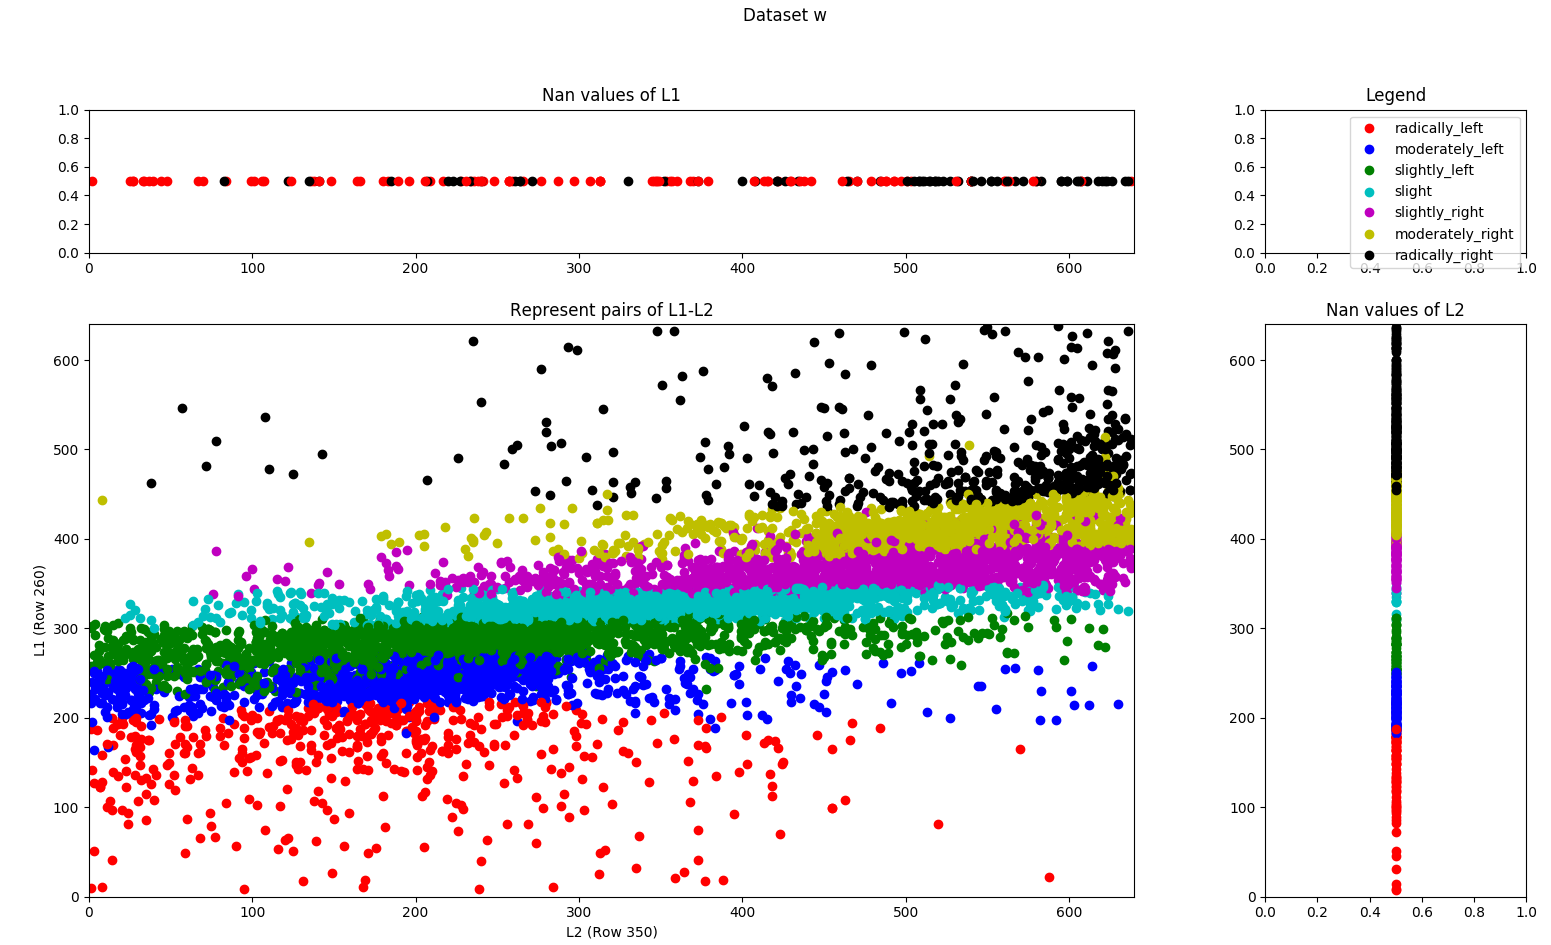
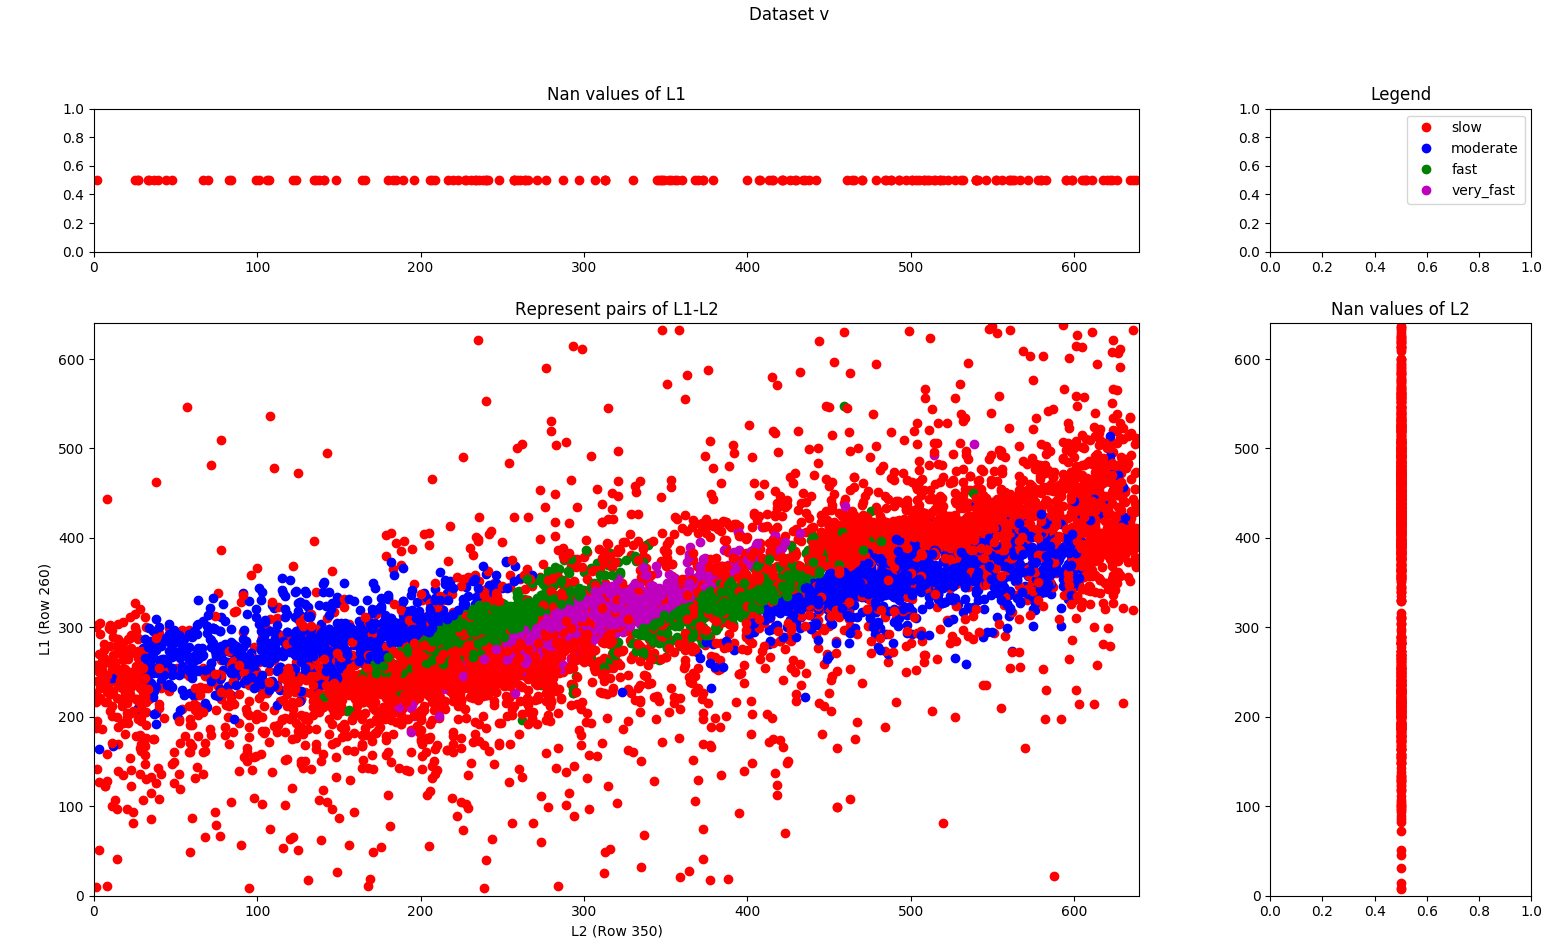
To analyze the data, I’ve analyzed two lines of each image and calculated the centroids of the corresponding lines (row 250 and row 360). On the x-axis of the graph, the centroid of row 350 is represented and the y-axis represents the centroid of row 260 of the image. In the following images we can see the representation of this statistic of the training set (new dataset) for w and for v.
In the next image we see how the points are divided by colors according to their class of w (7 classes). Class “radically_left” is represented in red, class “moderately_left” is represented in blue, class “slightly_left” is represented in green, class “slight” is represented in cyan, “slightly_right” is represented in purple, “moderately_right” is represented in yellow, and “radically_right” is represented in black.
In the next image we see how the points are divided by colors according to their class of v (4 classes). Class “slow” is represented in red, class “moderate” is represented in blue, class “fast” is represented in green, and “very_fast” is represented in purple.
Diving analysis
I’ve relabelled the images from https://github.com/RoboticsURJC-students/2017-tfm-vanessa-fernandez/tree/master/Follow%20Line/Failed_driving at my criteria. And I’ve compared the relabelled data with the driving data. A 72% accuracy is obtained.
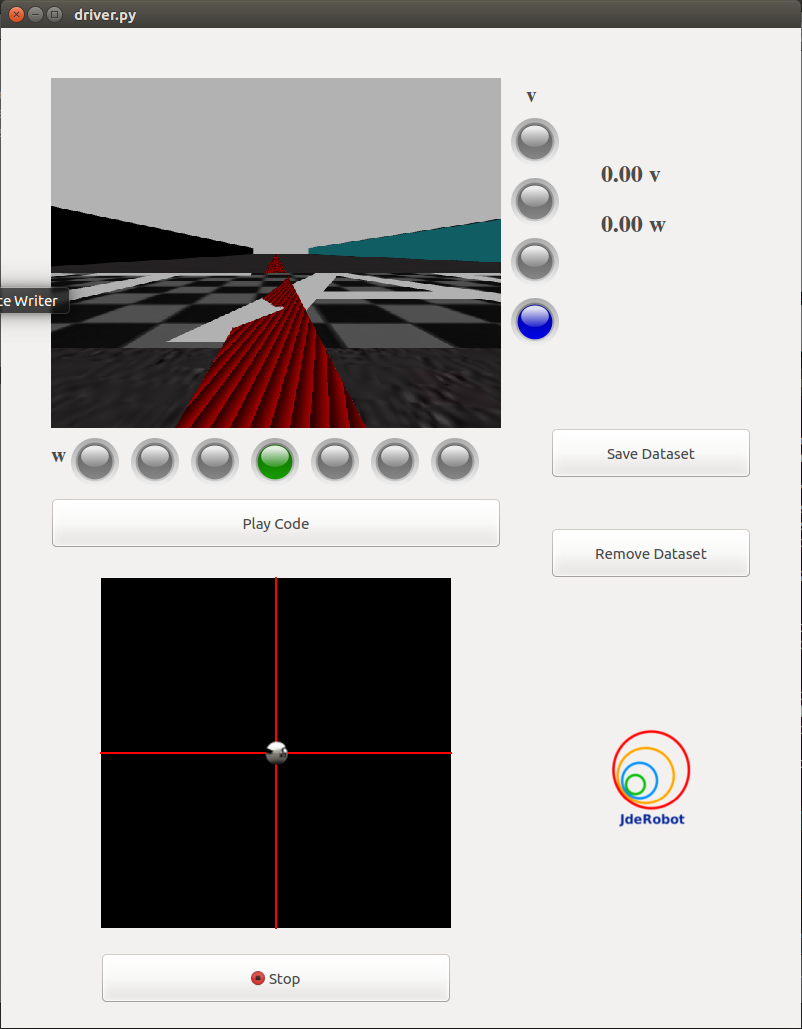
New gui
I’ve modified the gui adding LEDs. Under the image of the car camera there are 7 leds that correspond to the 7 classes of w. The LED that corresponds to the class predicted by the network will light. To the right of the image there are 4 leds for v that correspond to the 4 classes of v.