Looking at the distribution of cases in the dataset
Dataset distribution with and without extreme cases
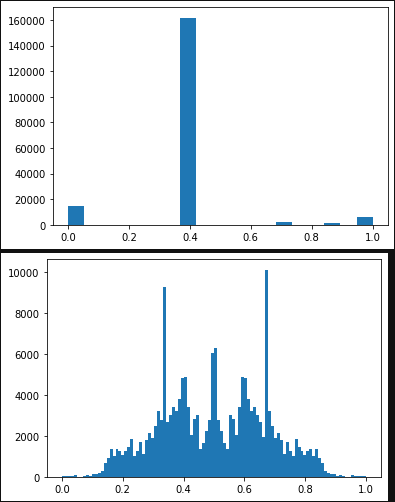
In the following images, we can see the different dataset distributions with and without extreme cases. Without extreme cases, the distribution of cases for the W variable (2 image on each pair) looks quite unbalanced, with the majority of cases in the middle of the plot.
Without extreme cases
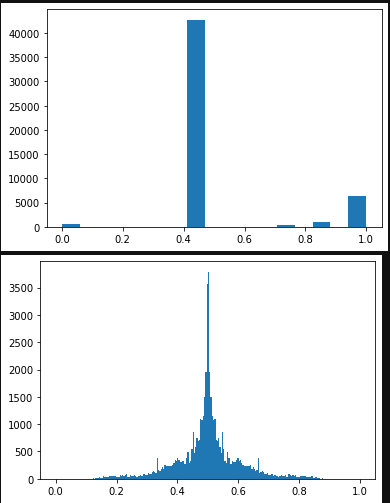
With extreme cases
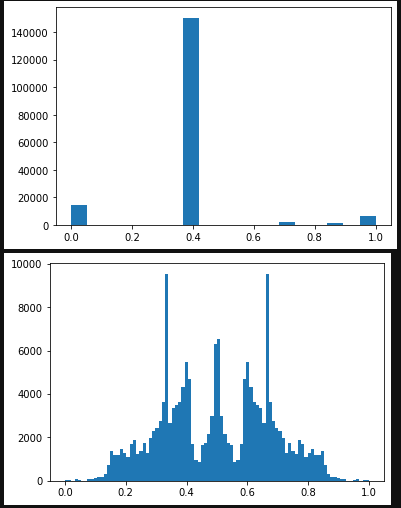
With even more extreme cases