Time cycle experiments analysis
Some findings:
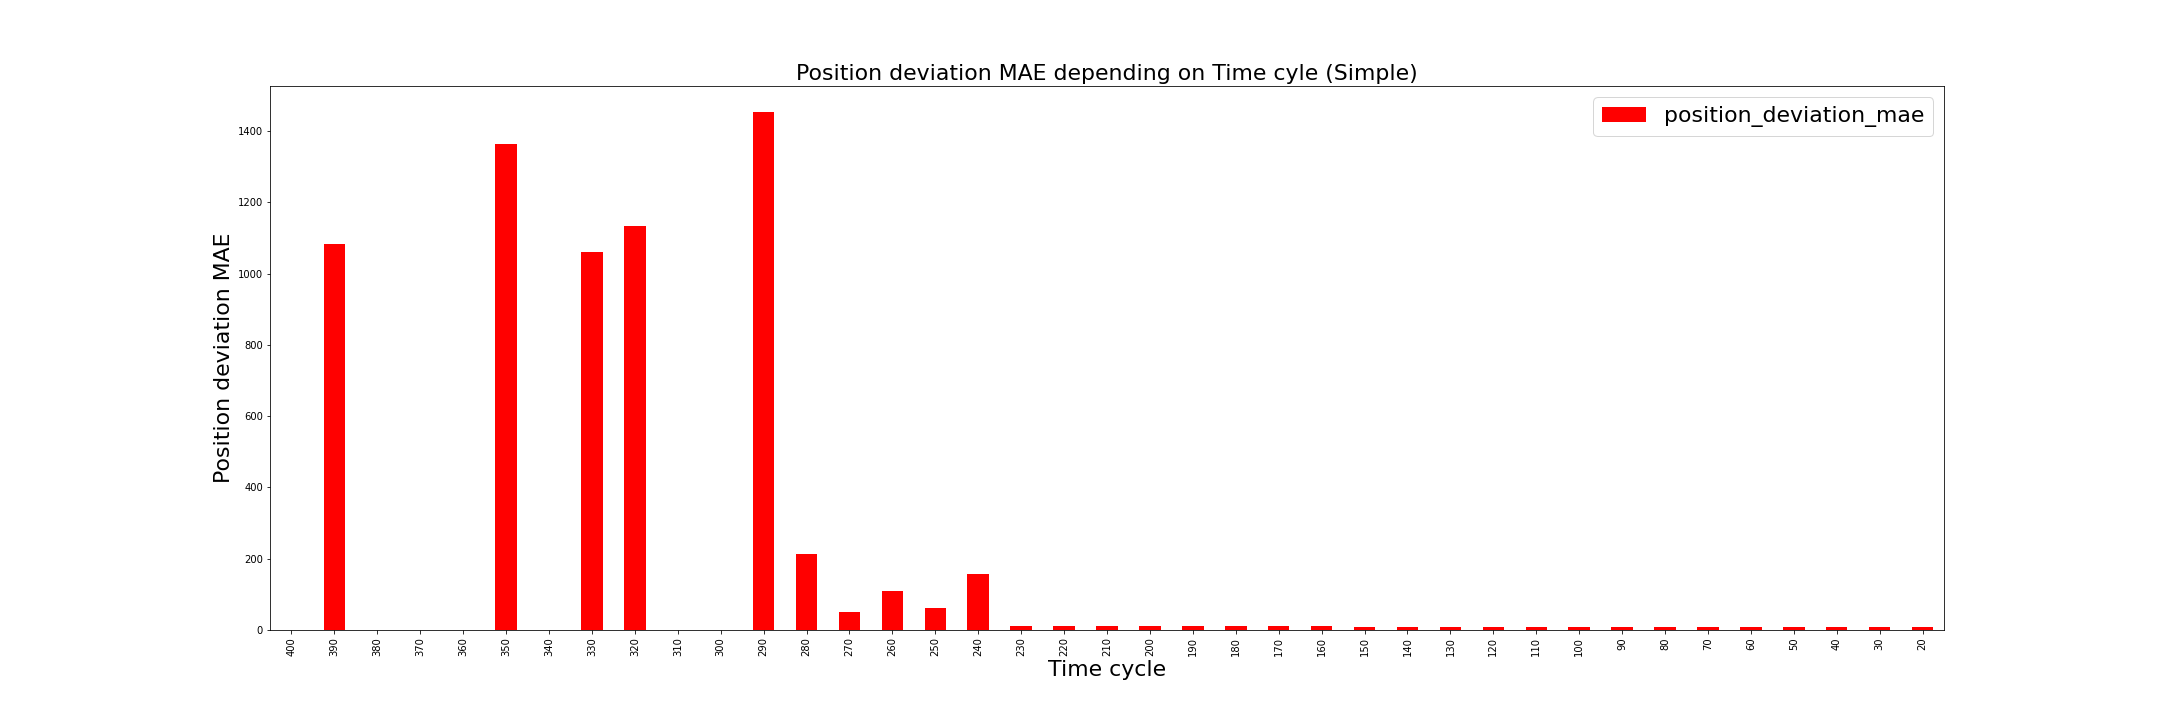
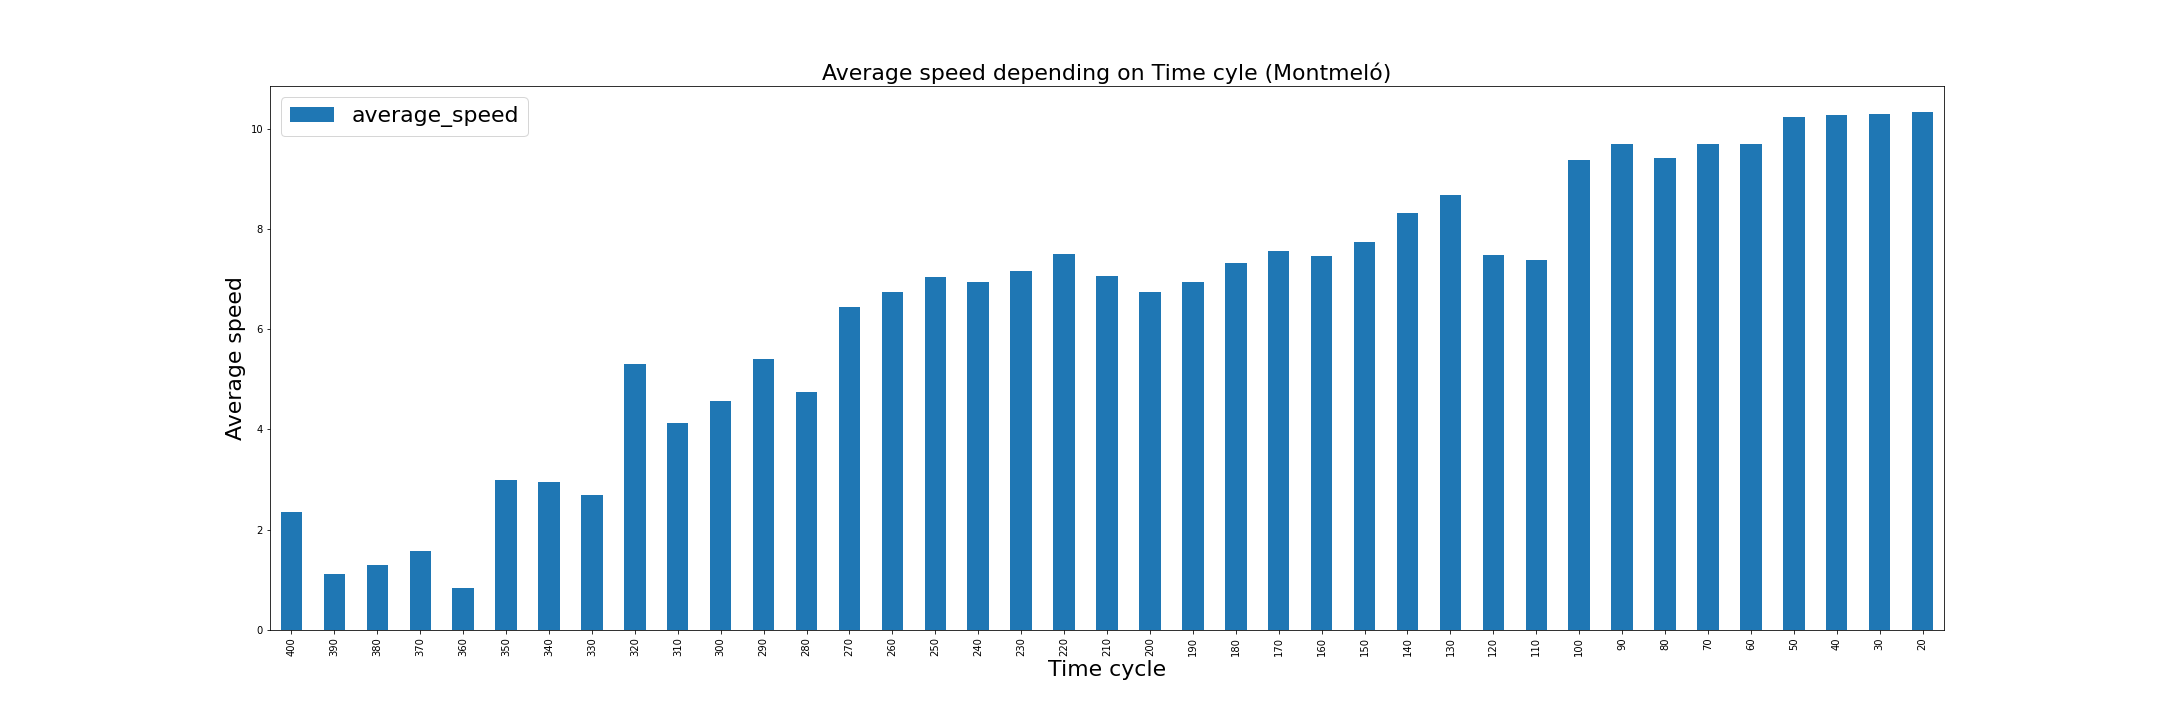
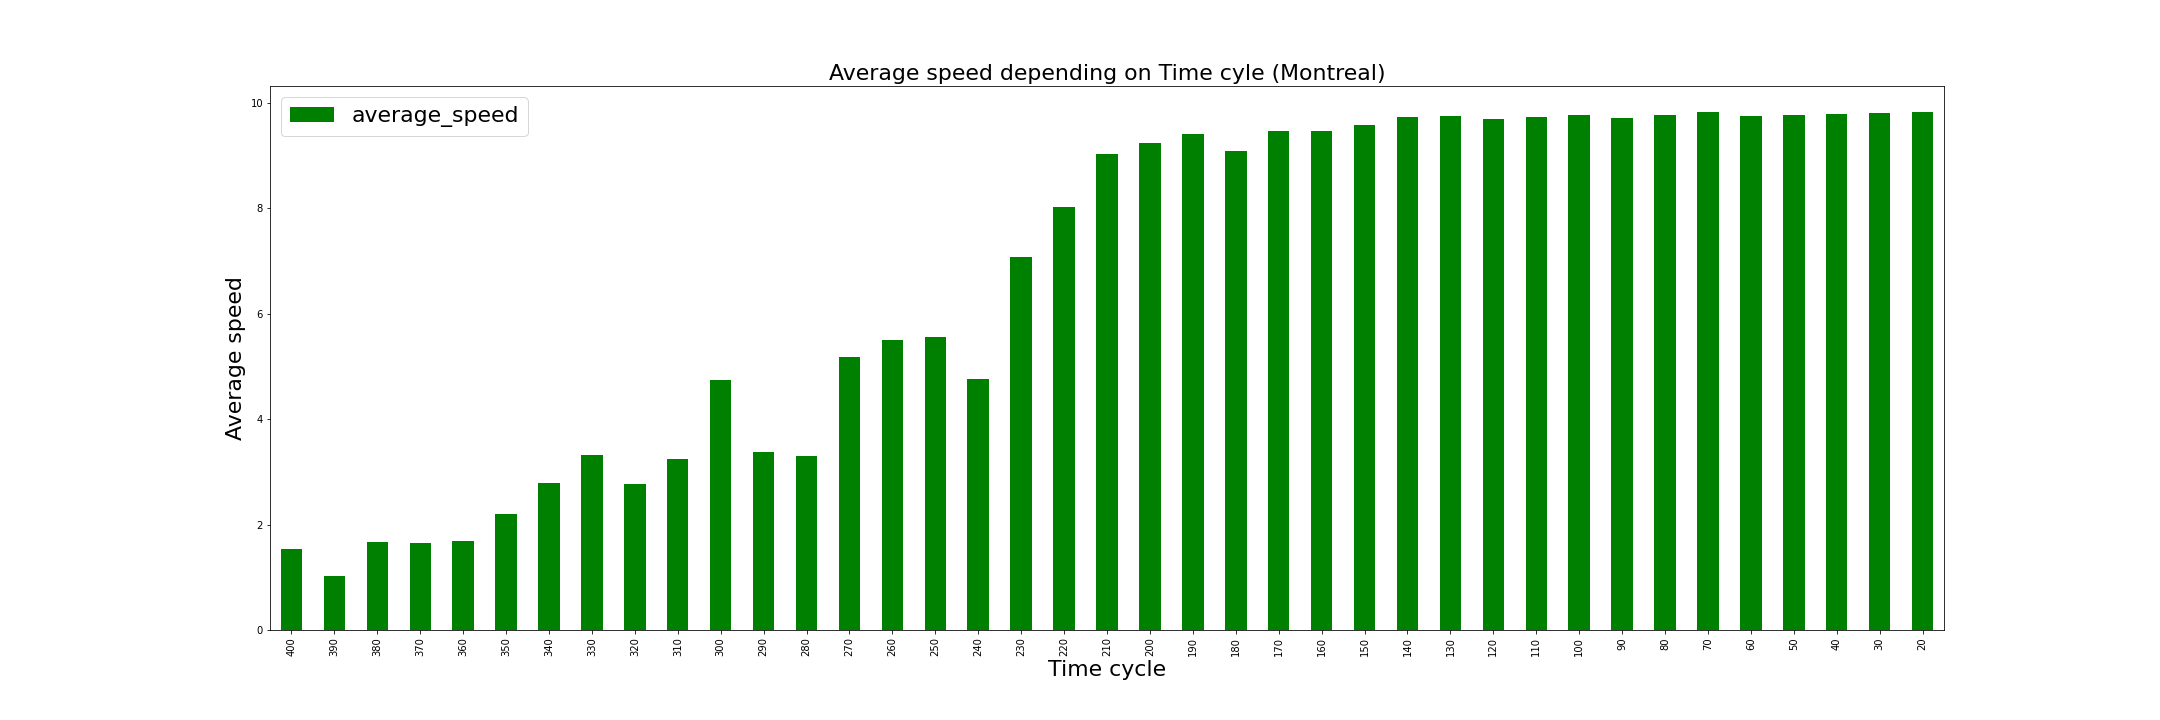
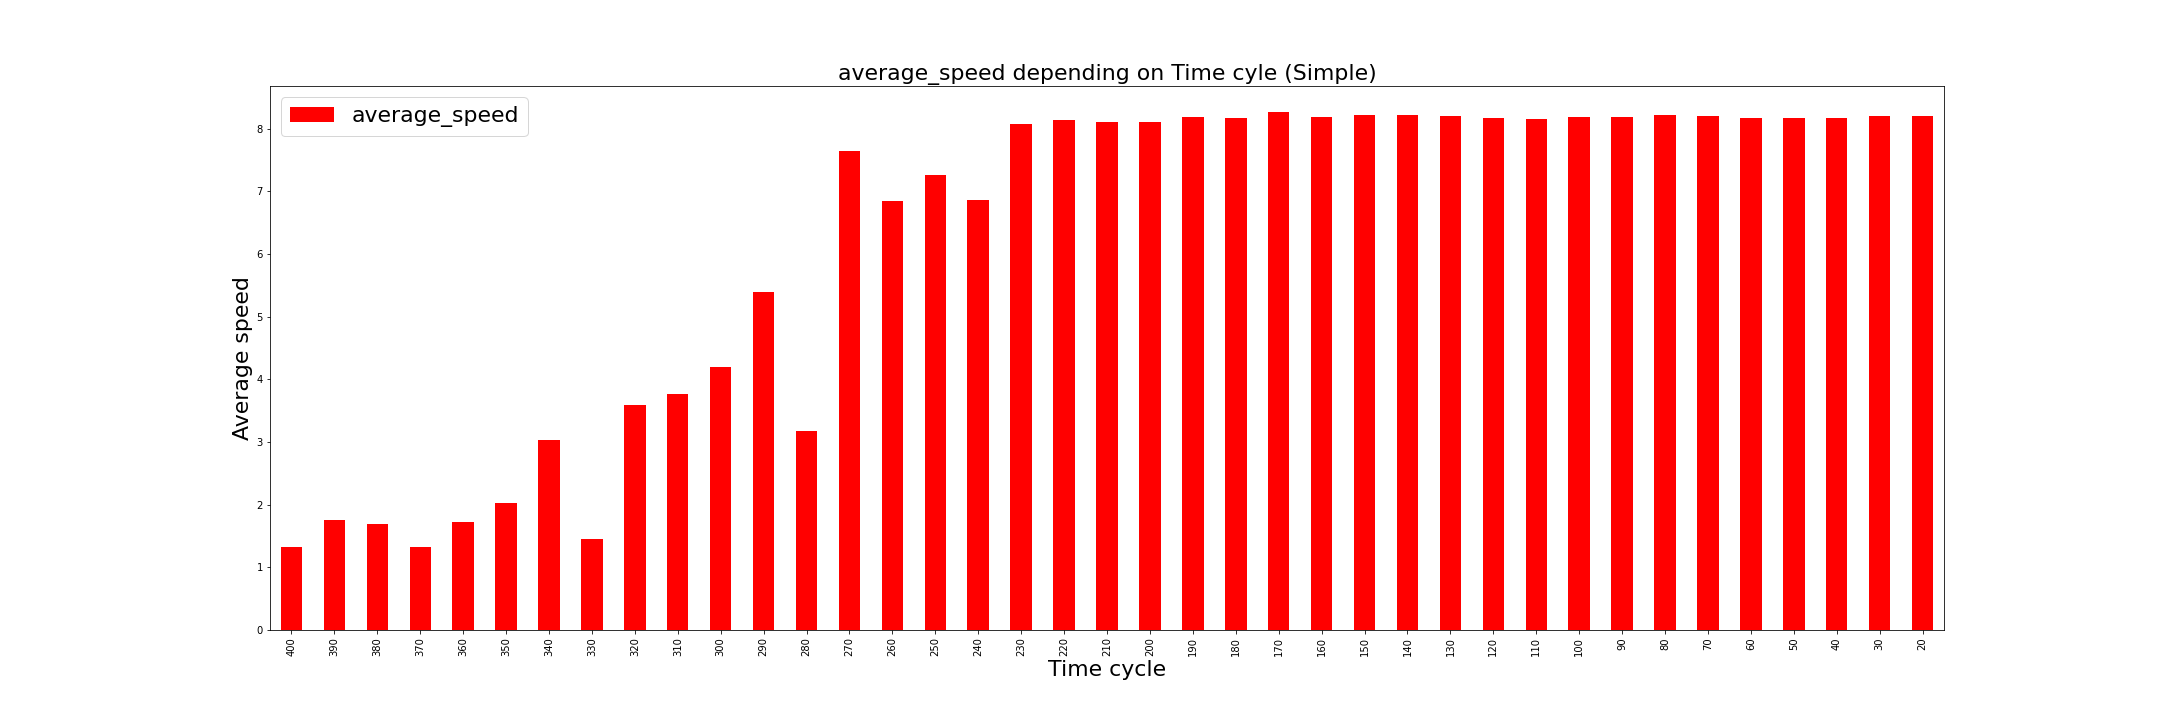
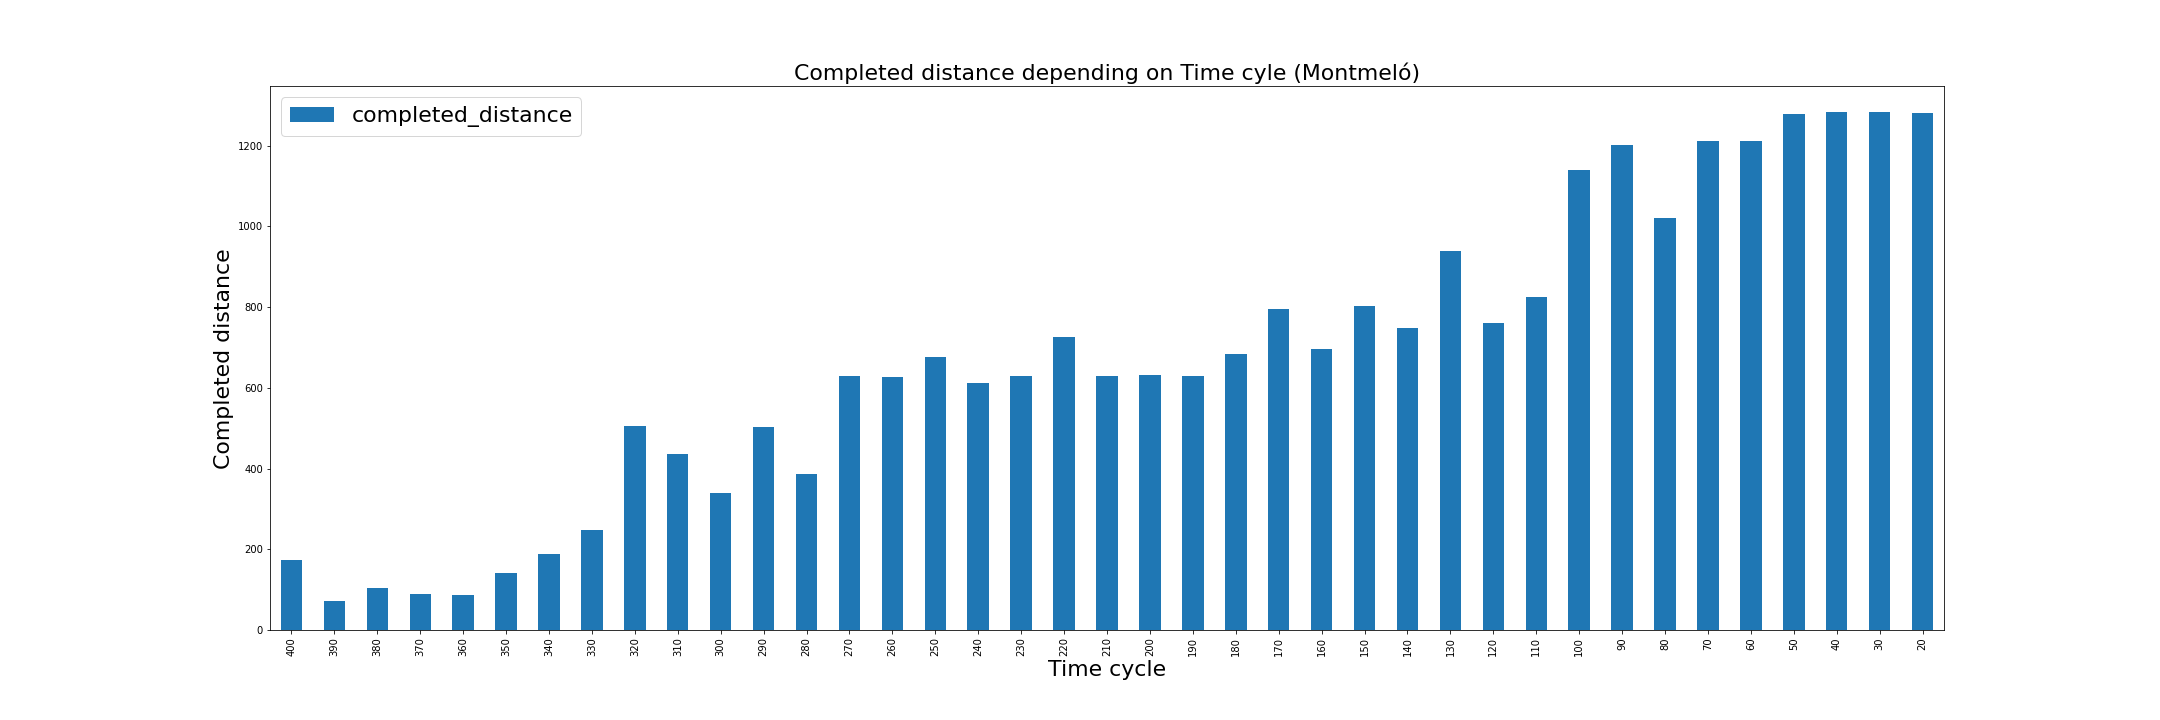
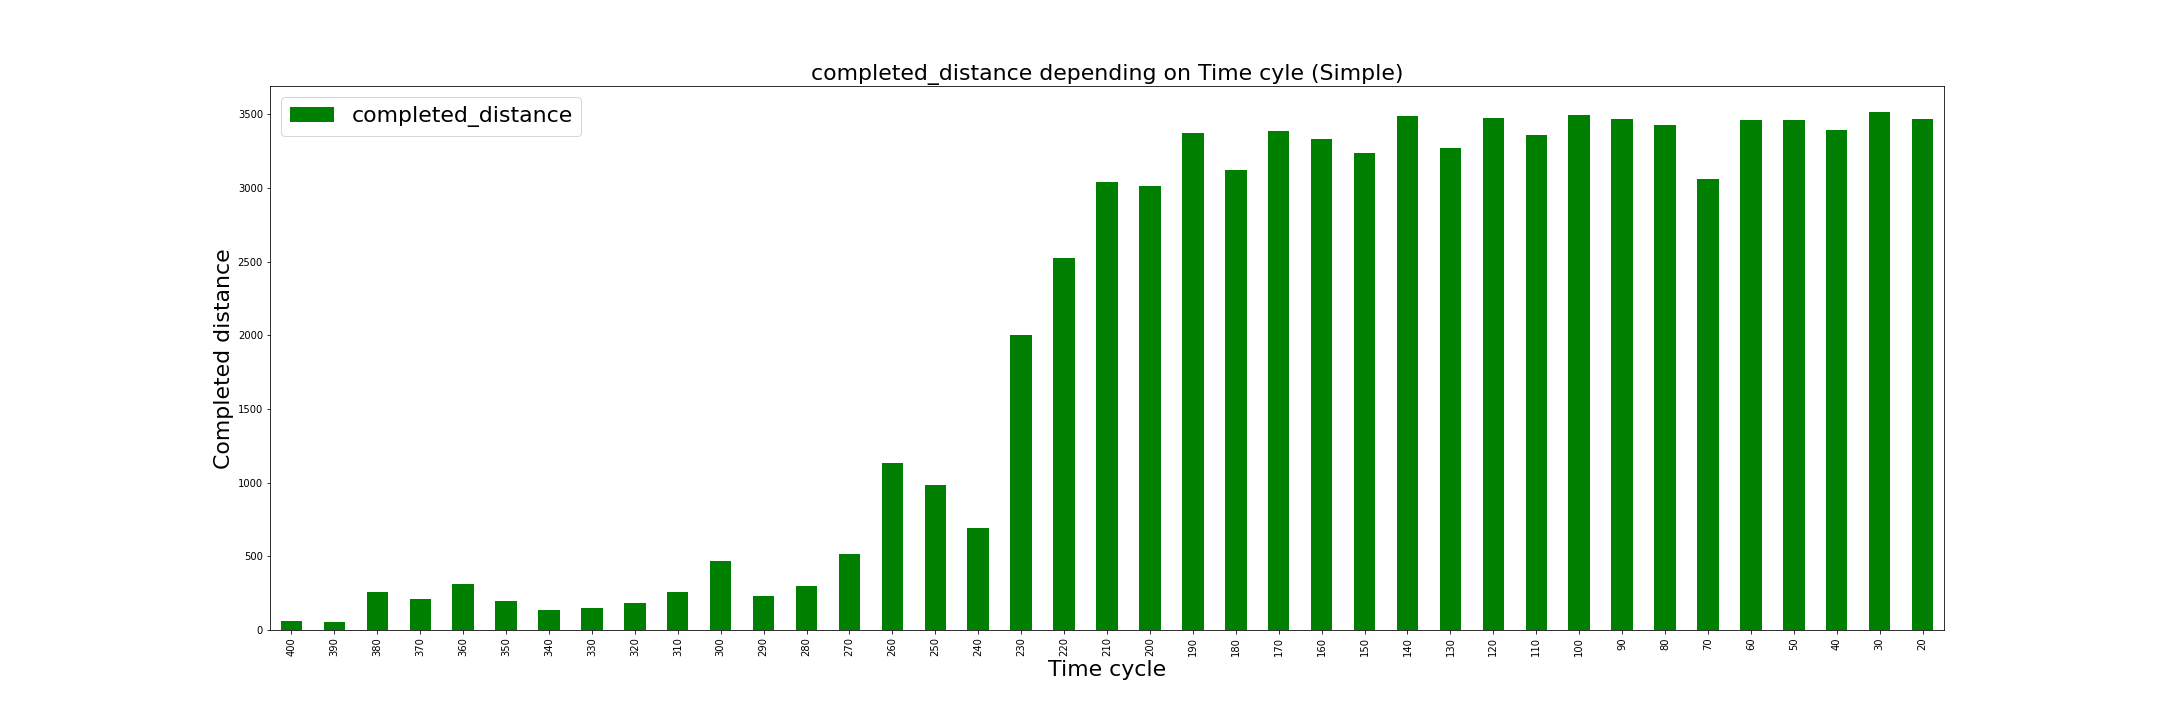
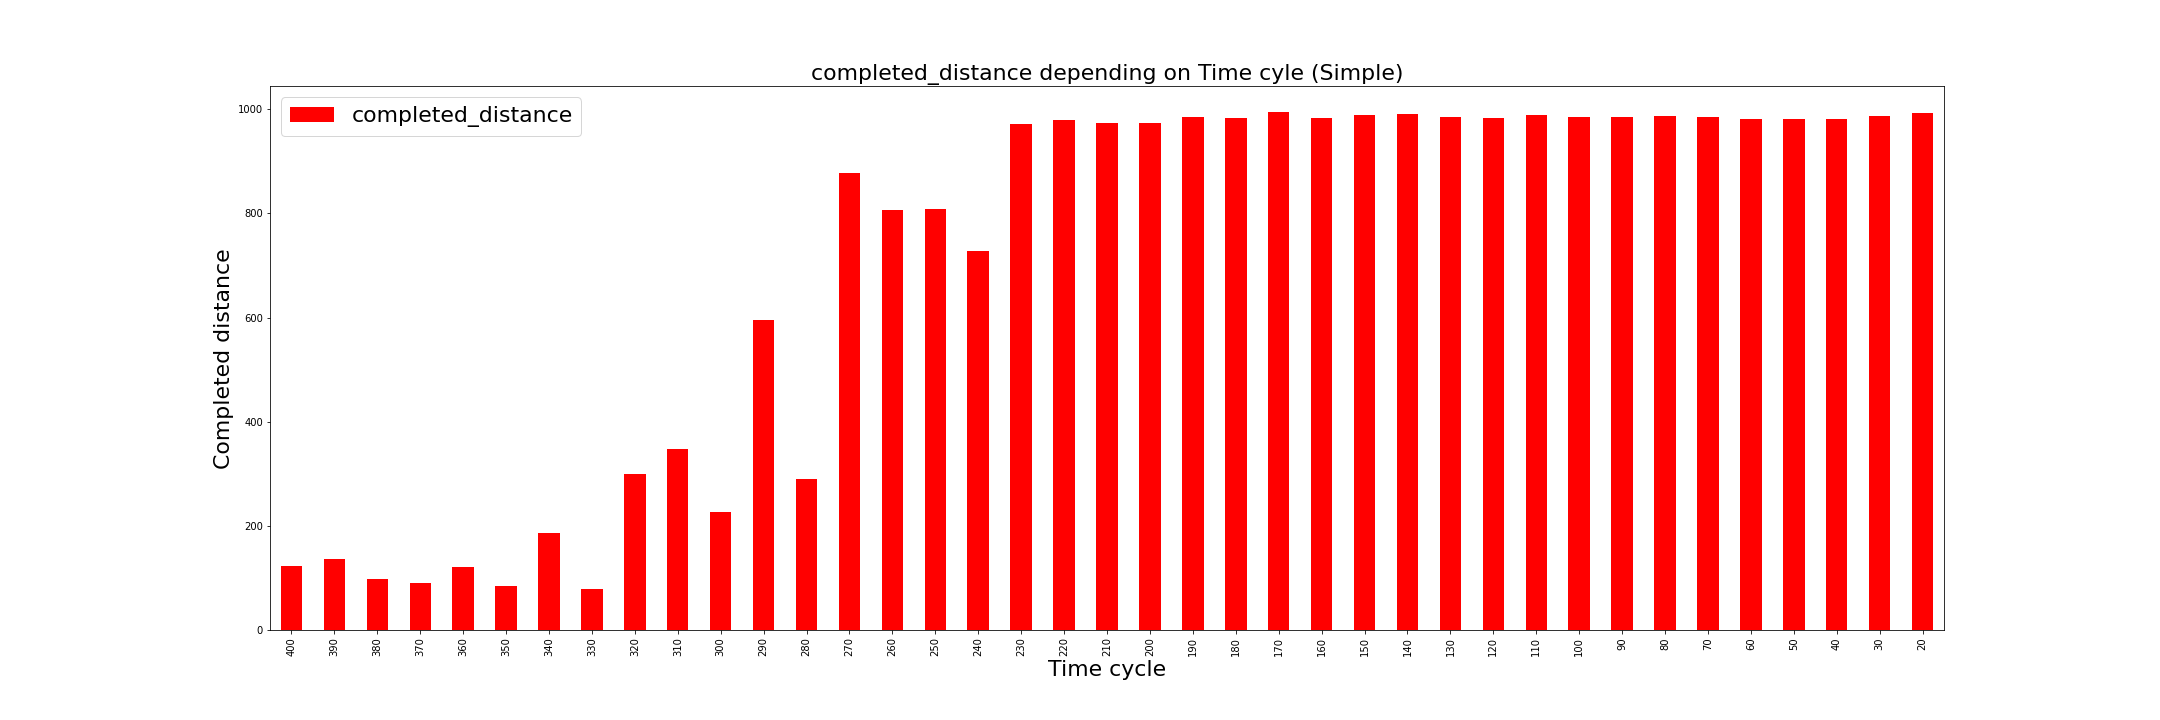
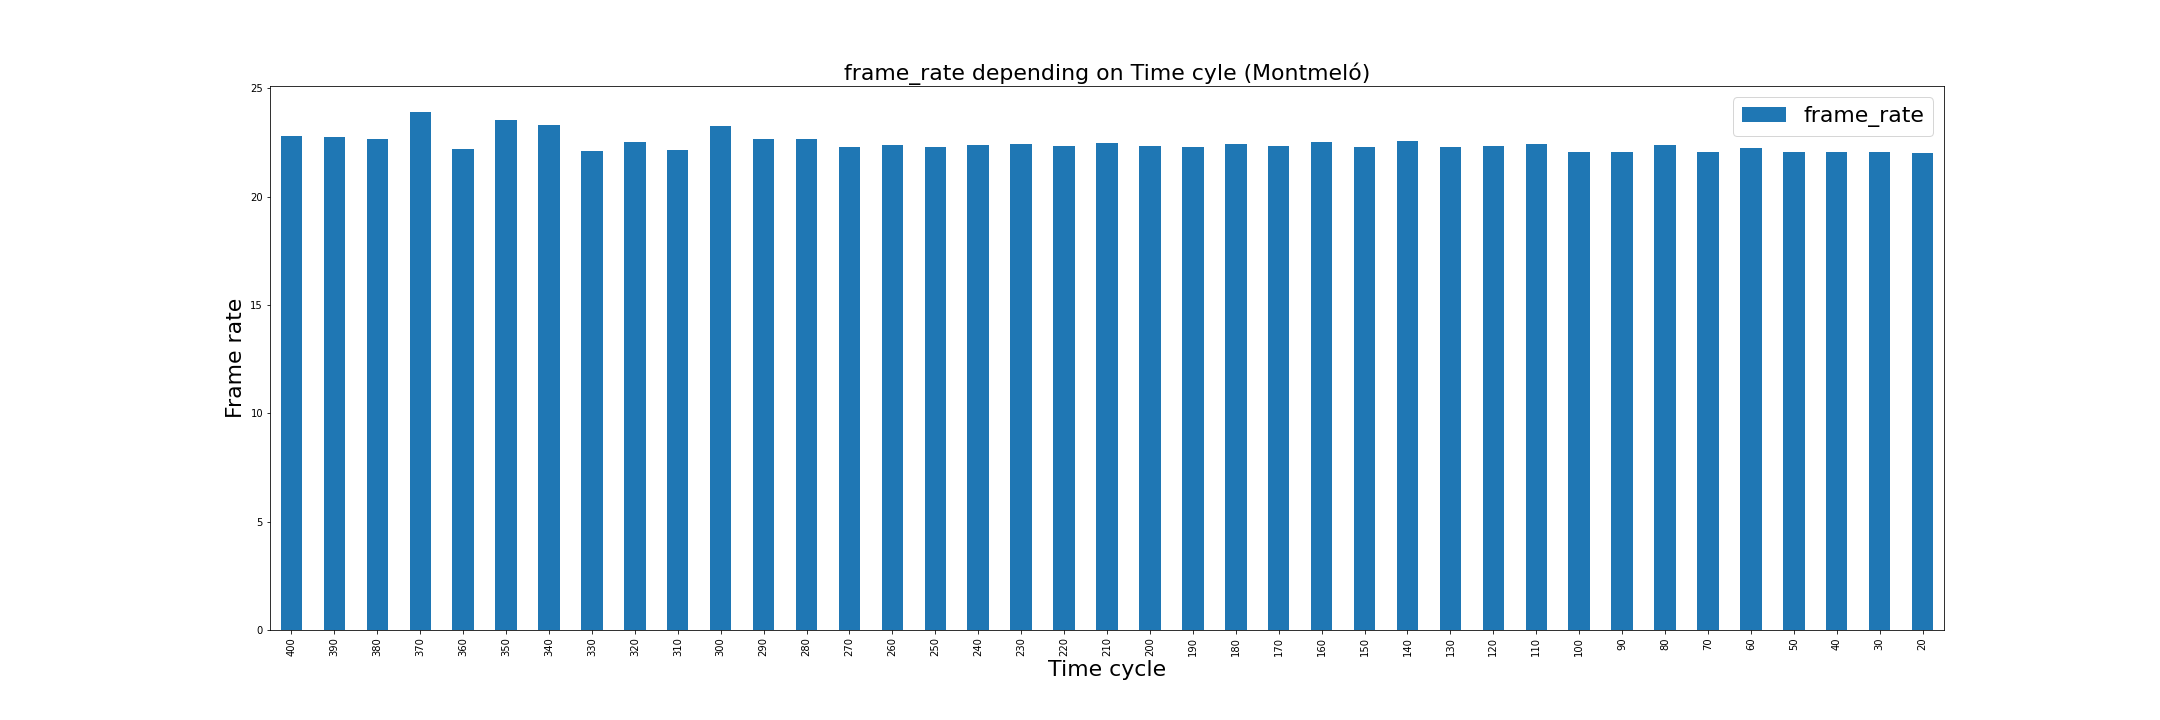
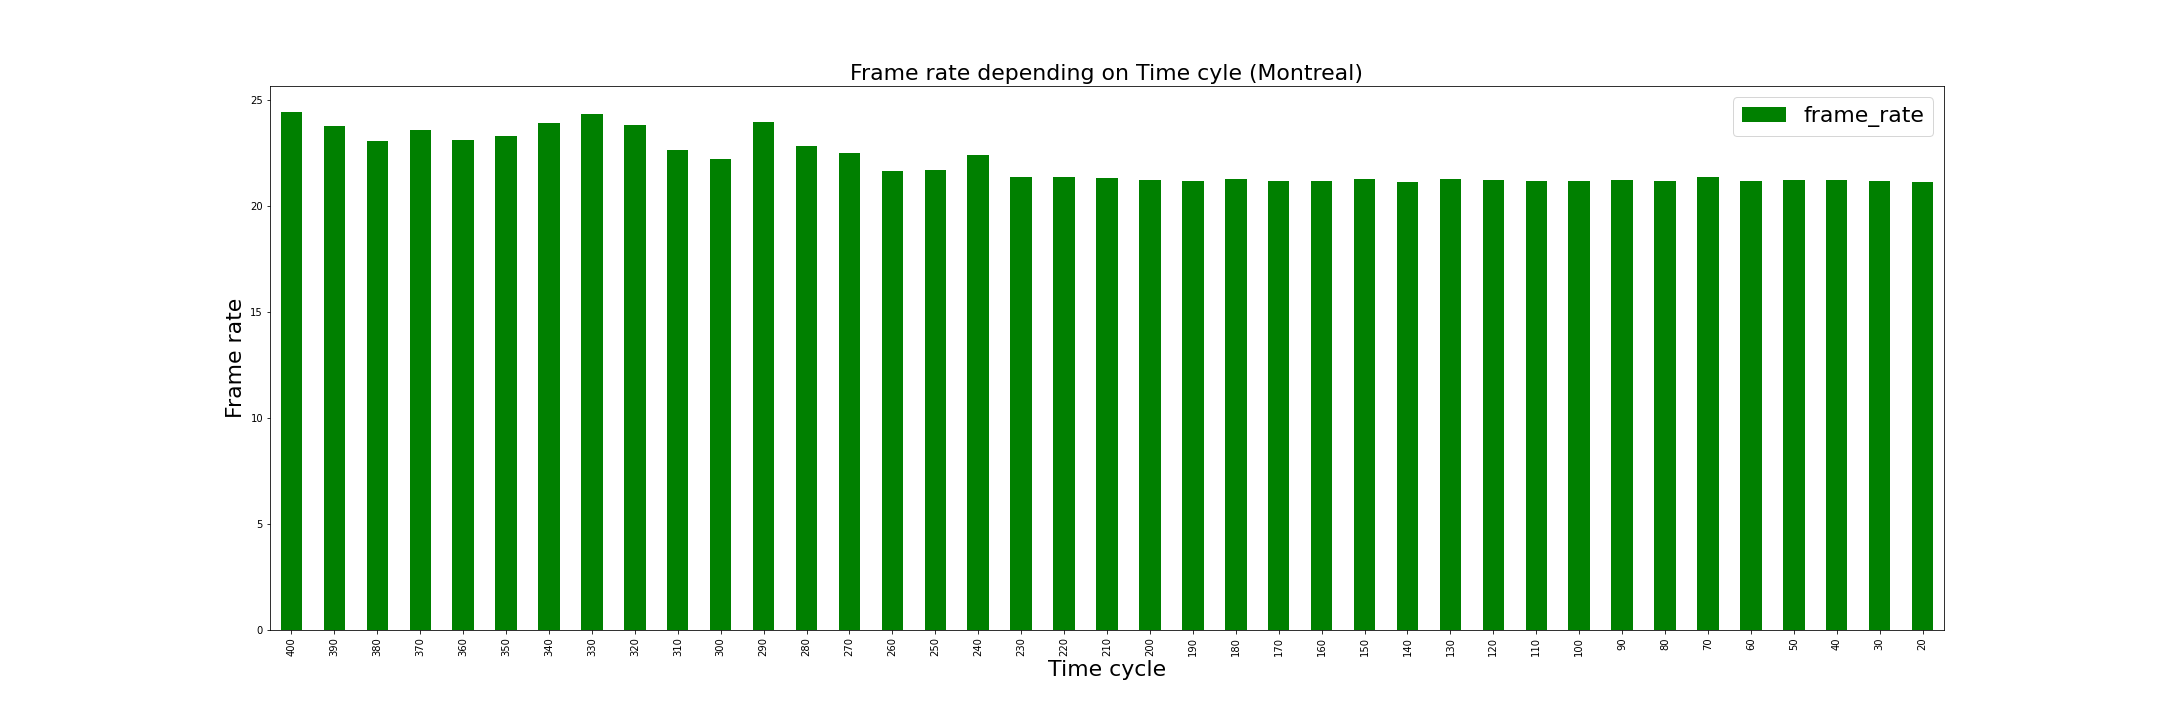
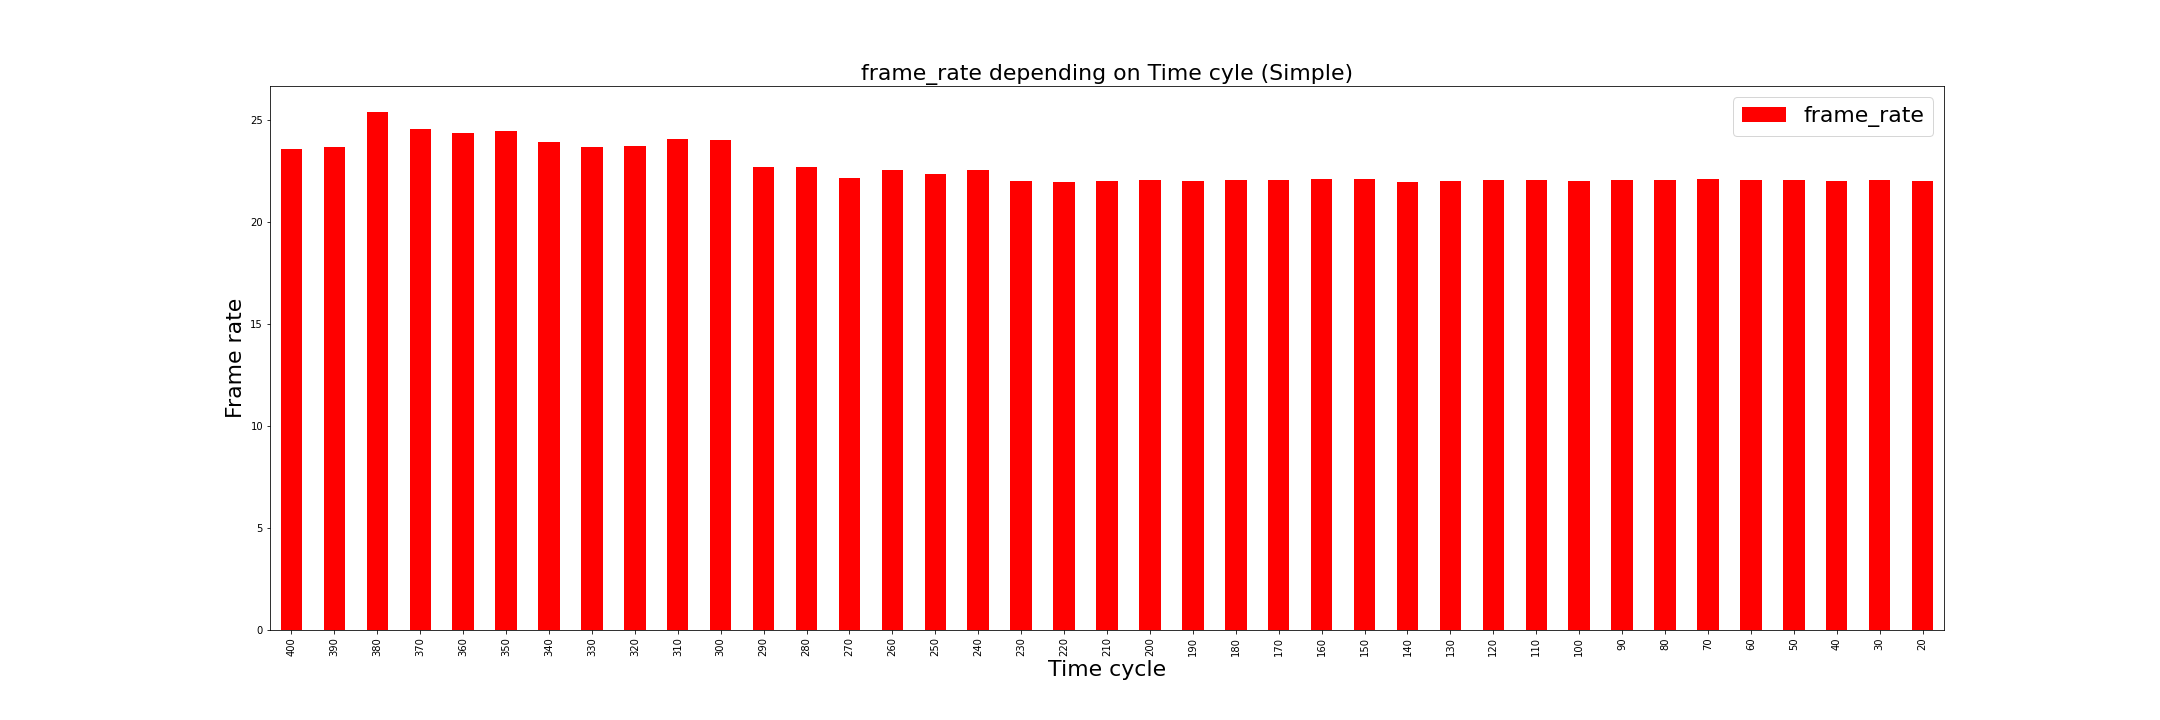
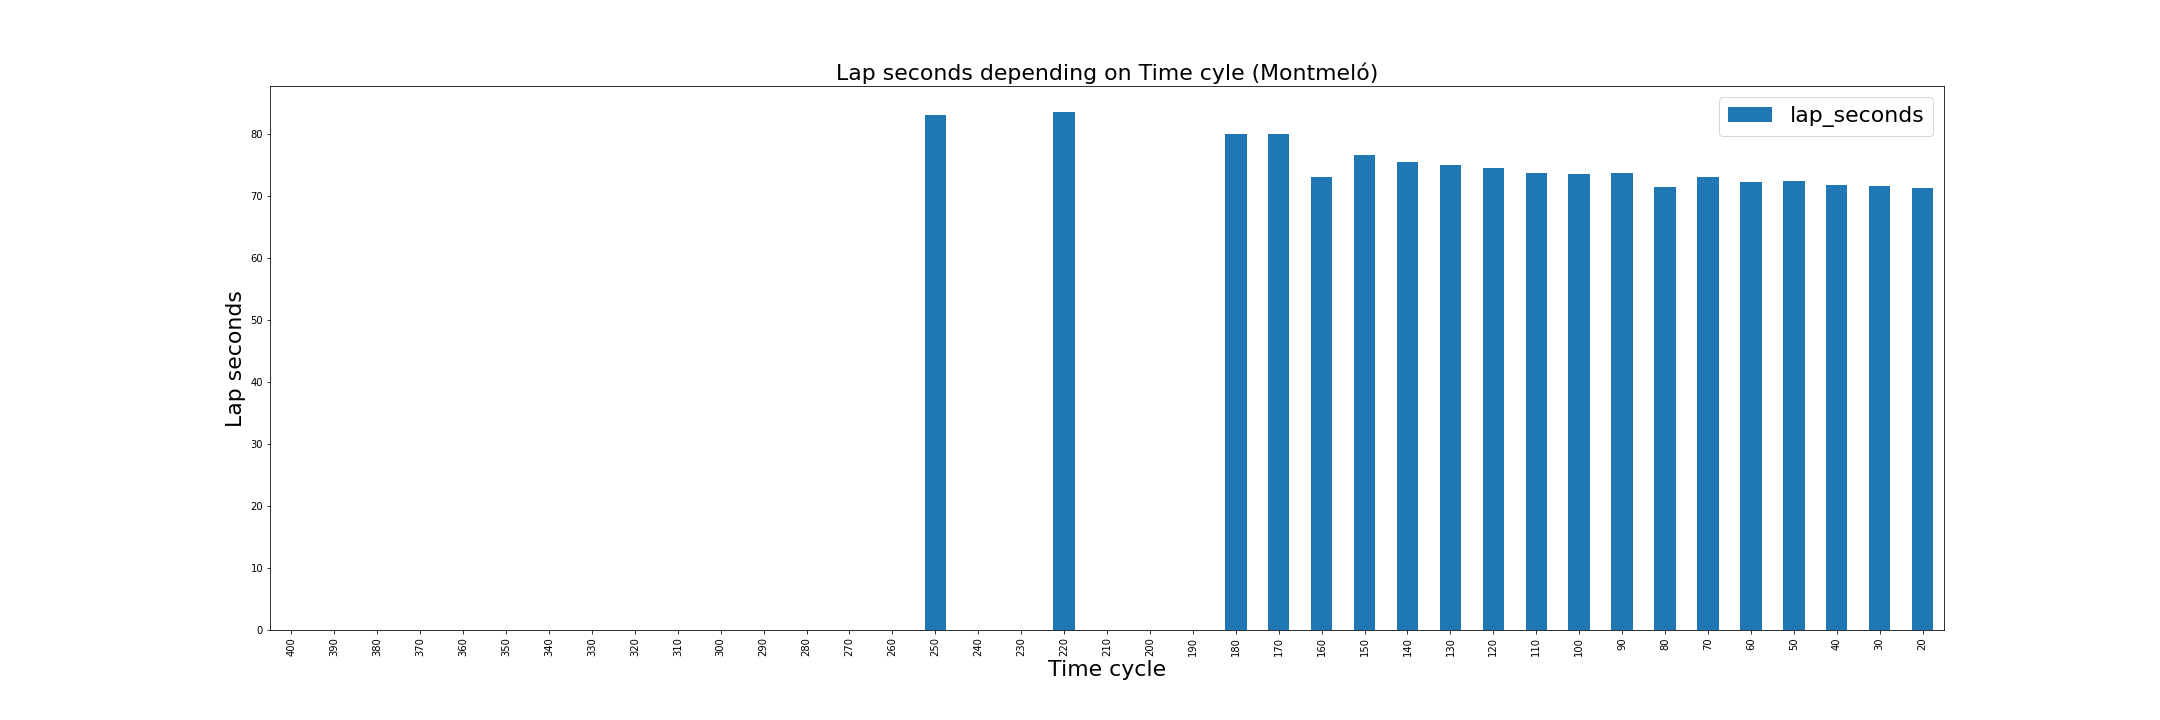
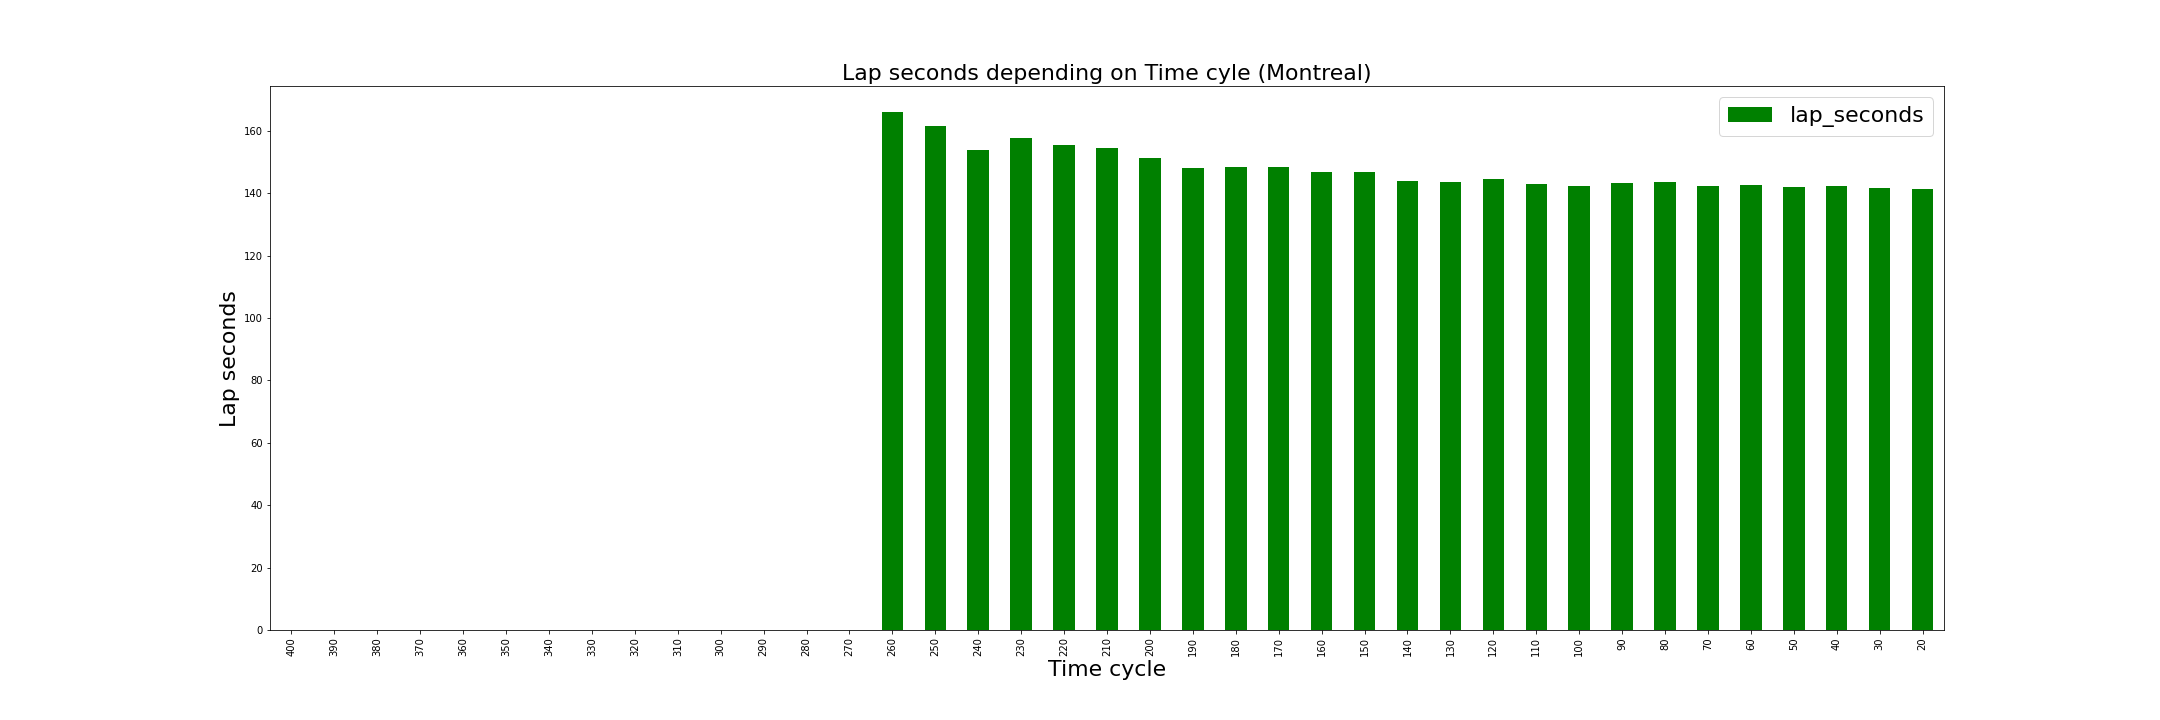
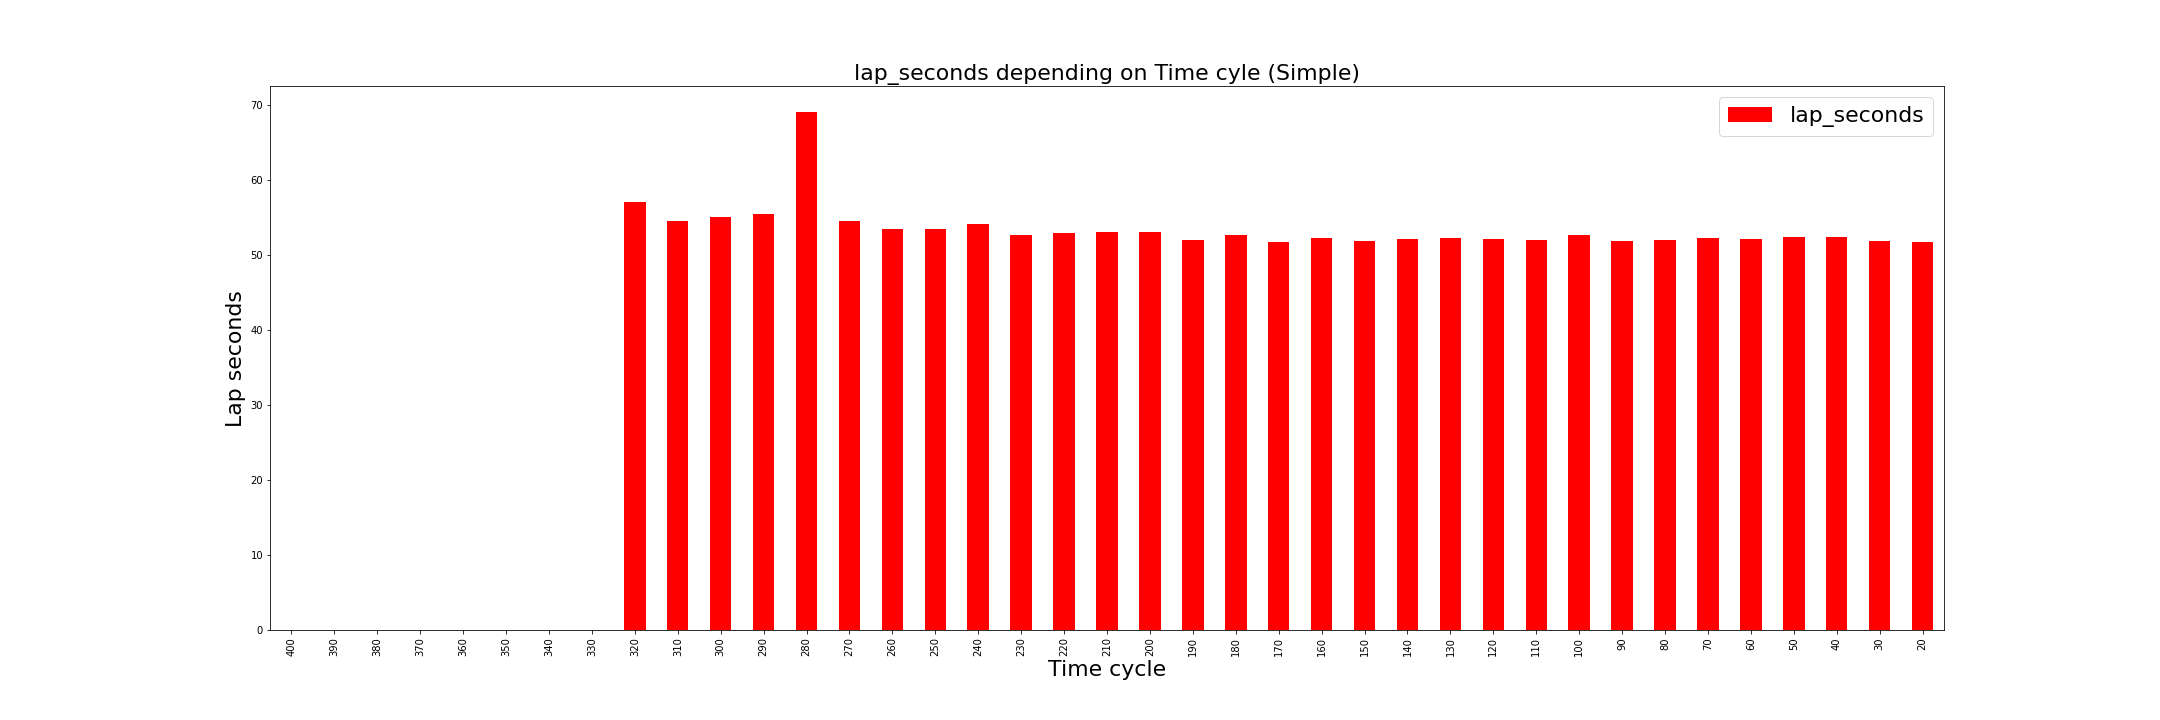
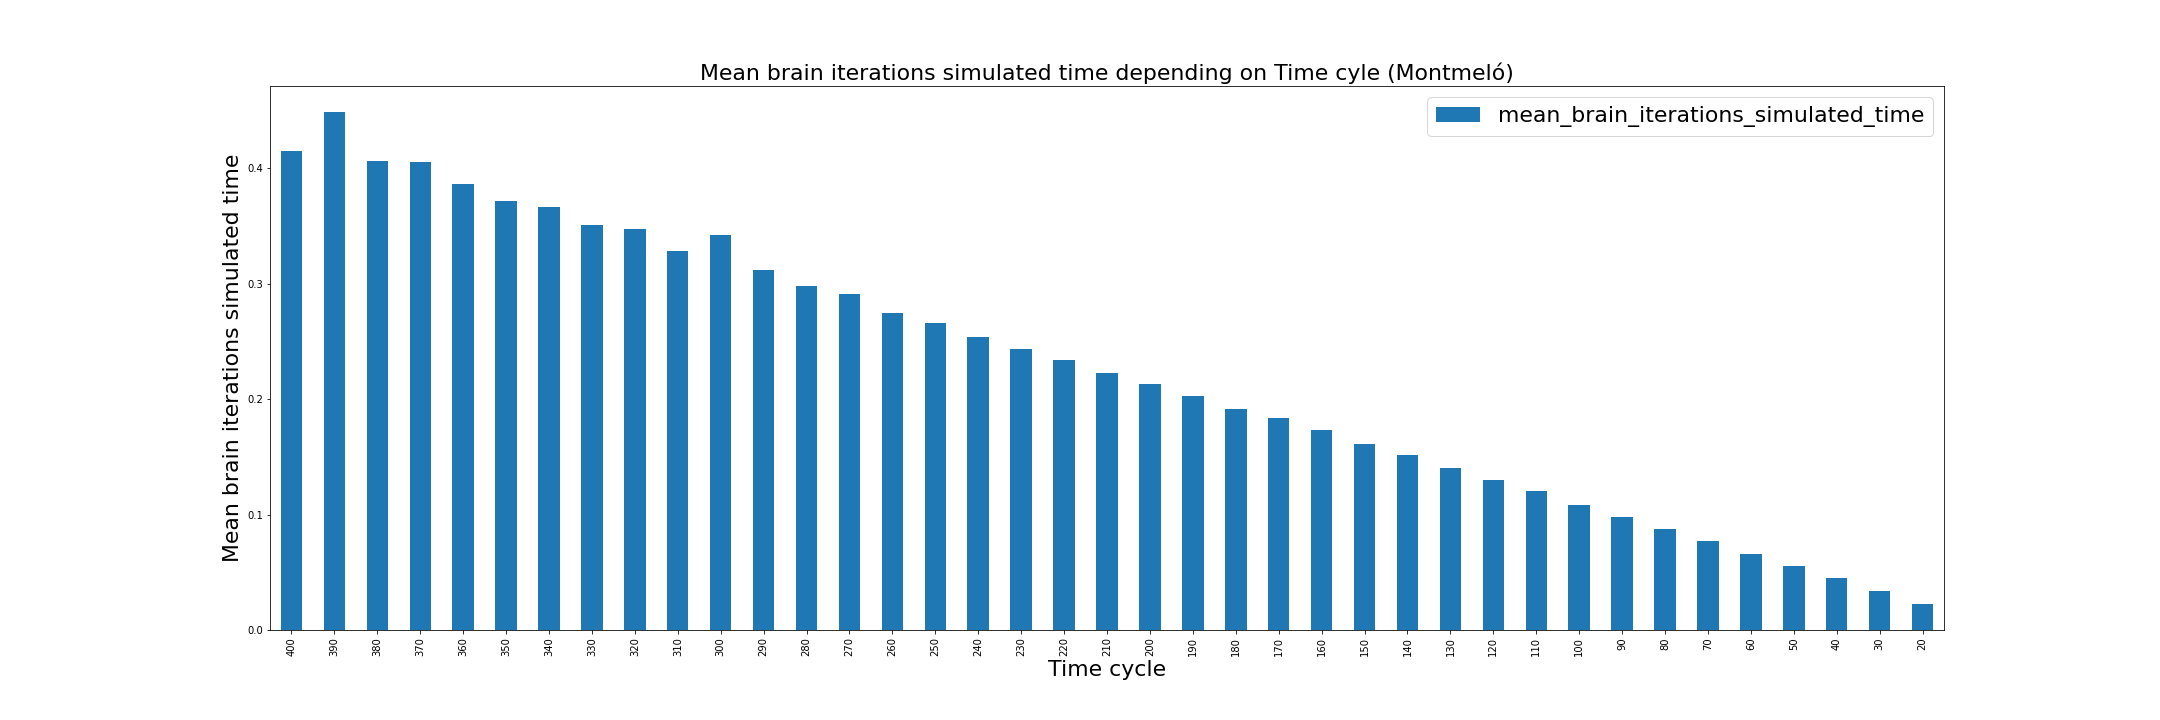
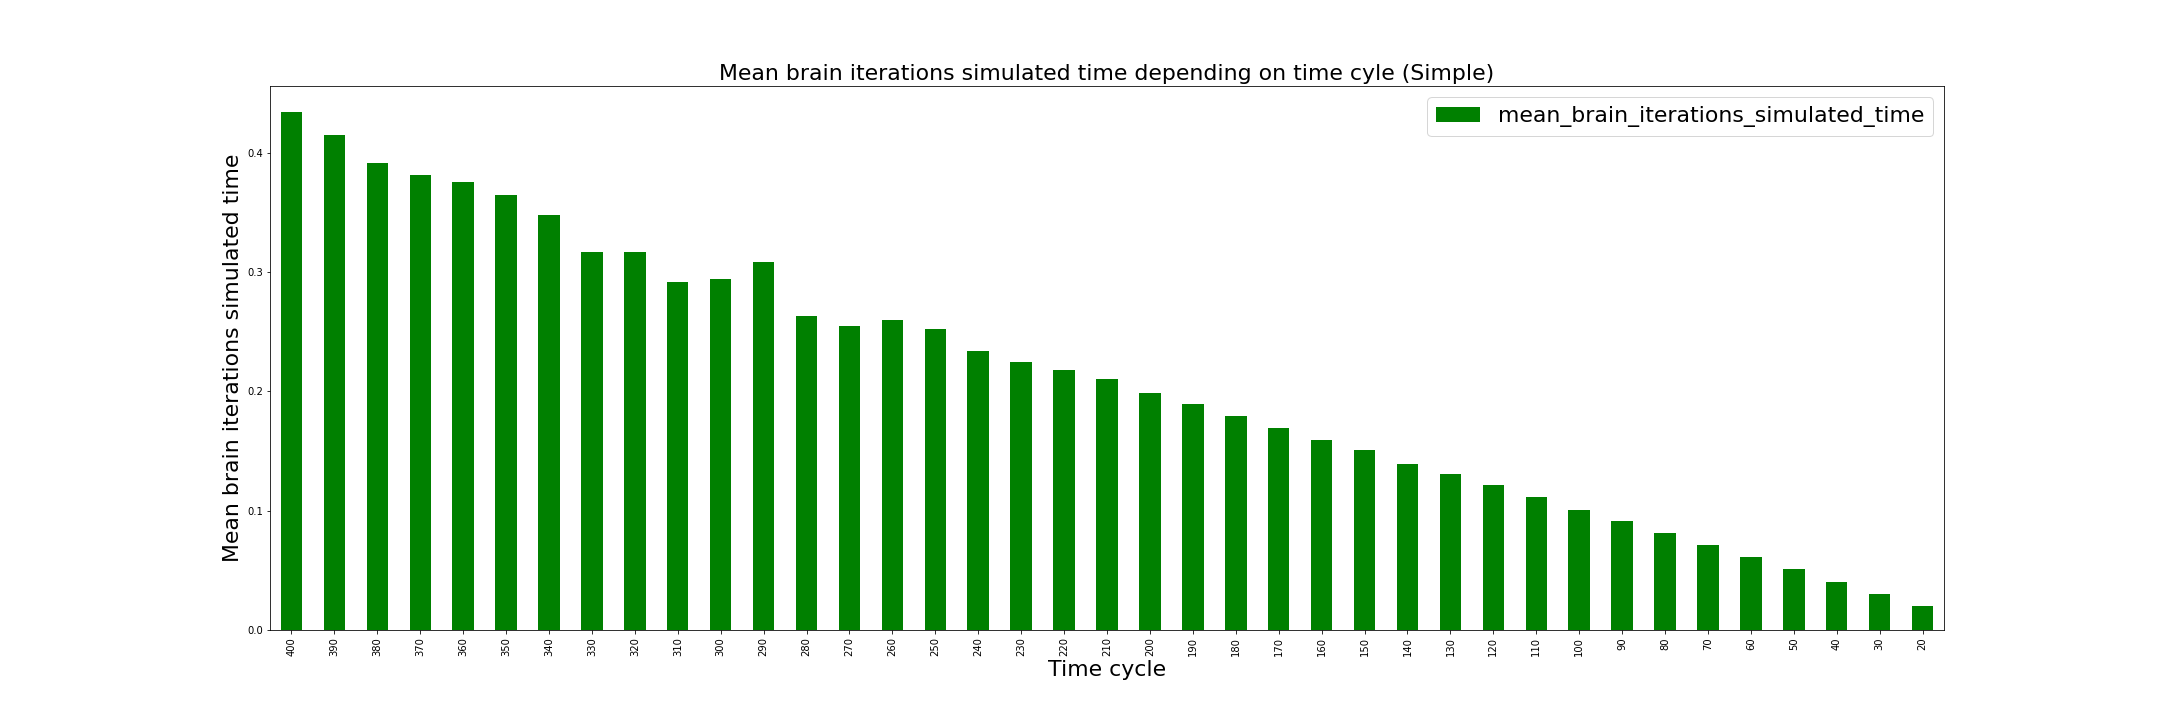
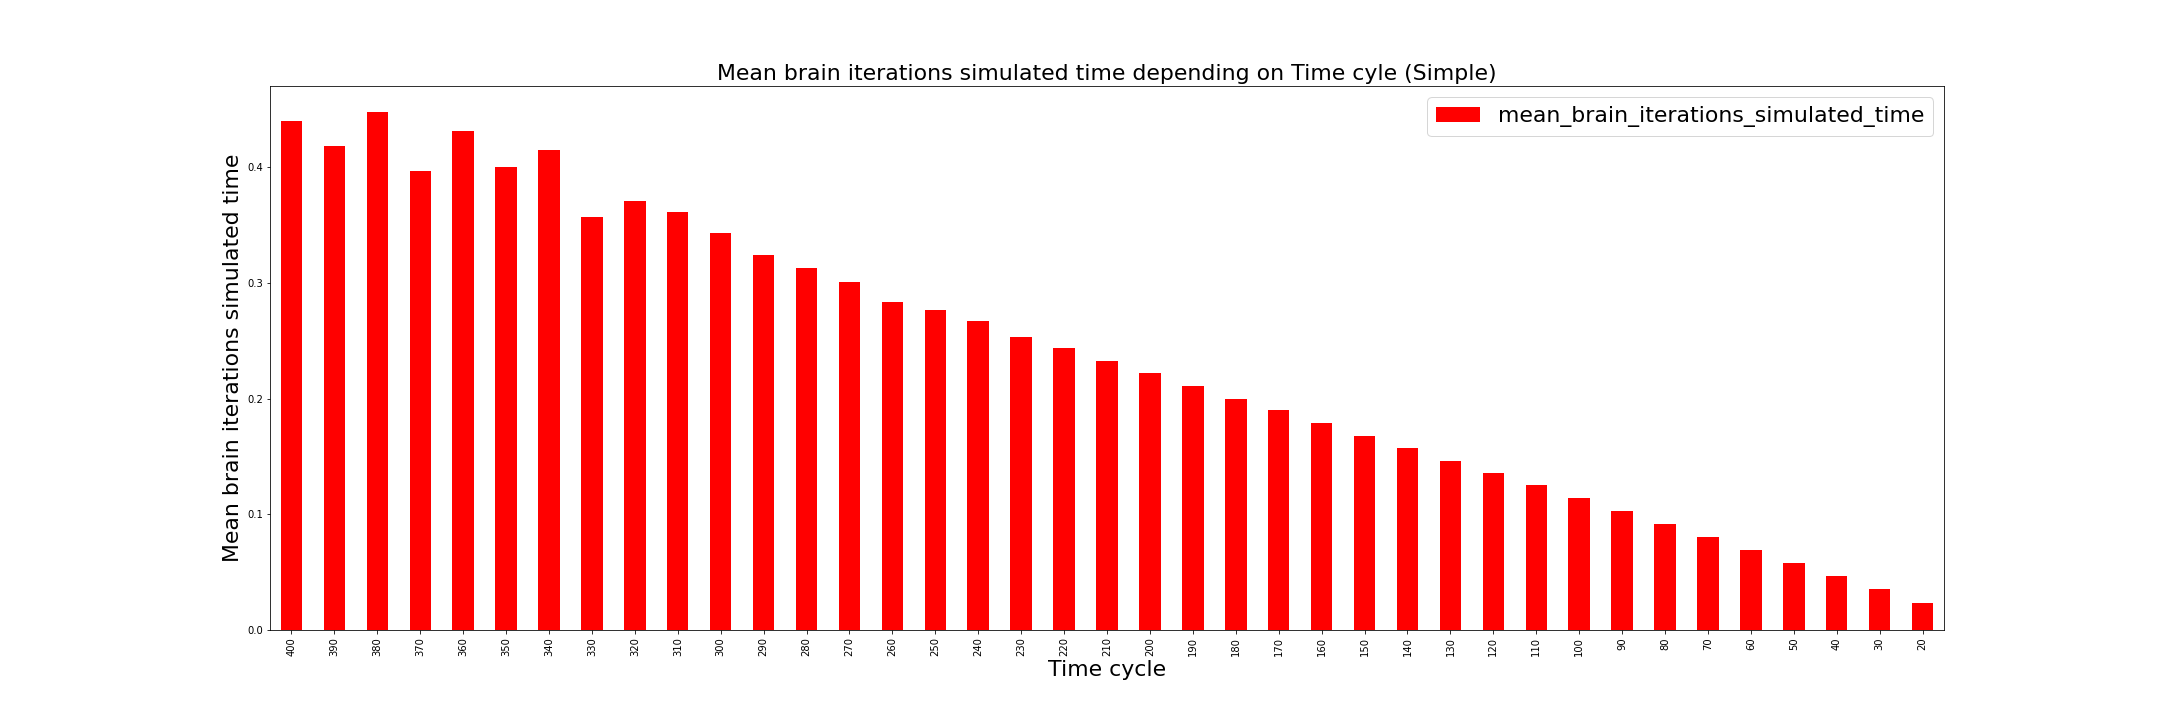
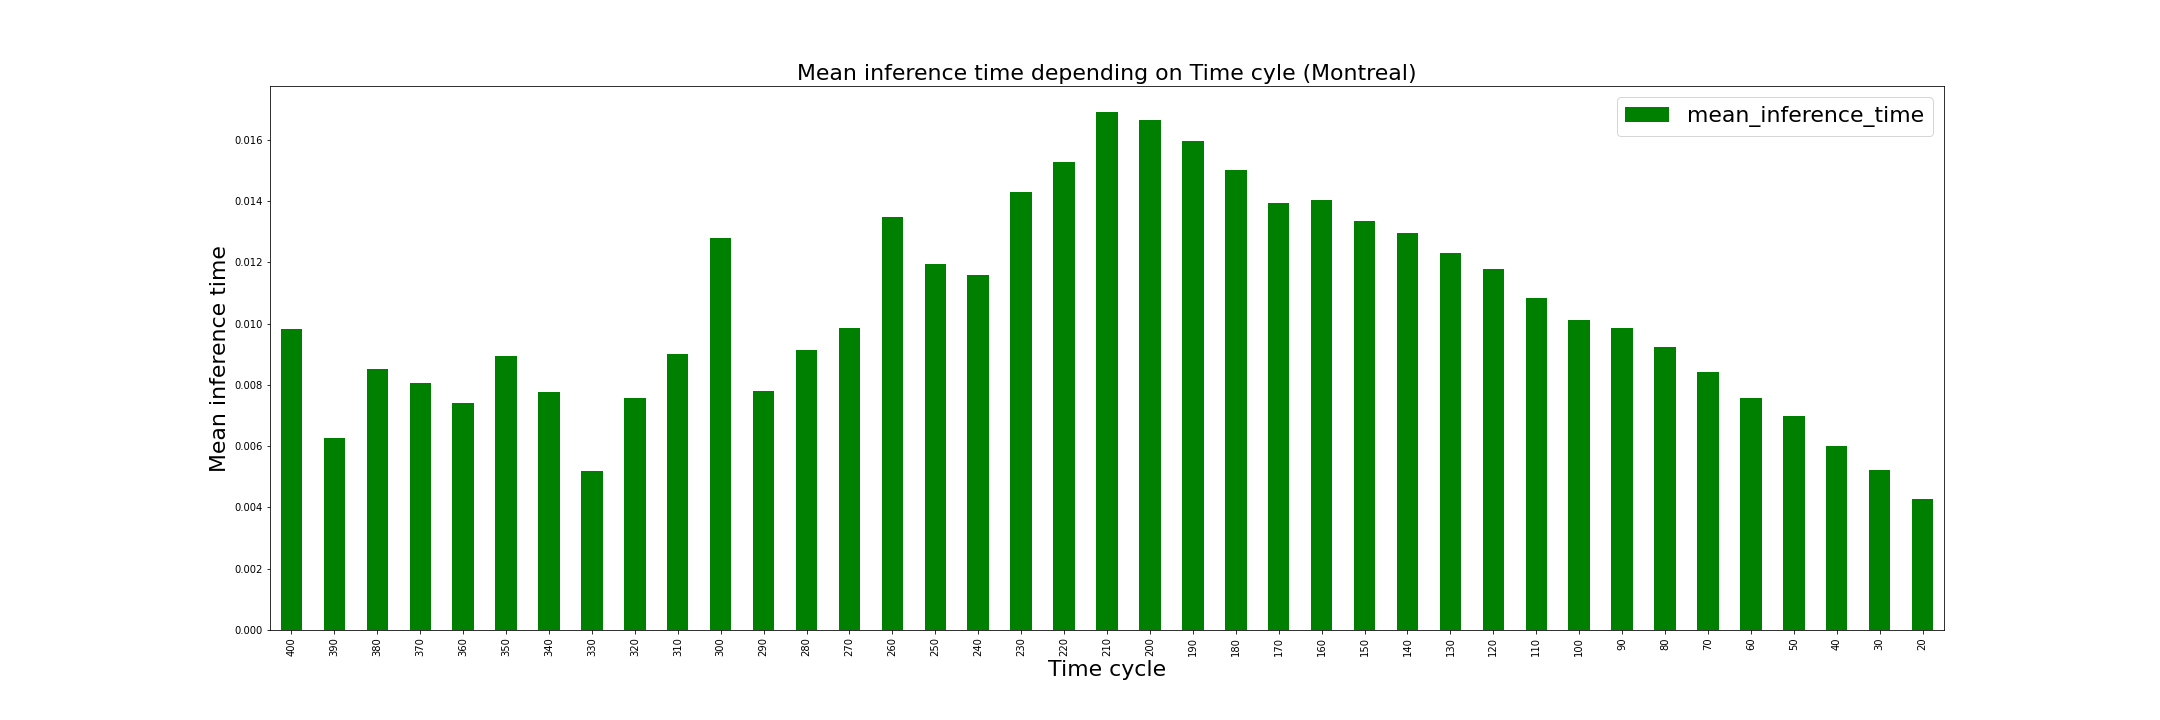
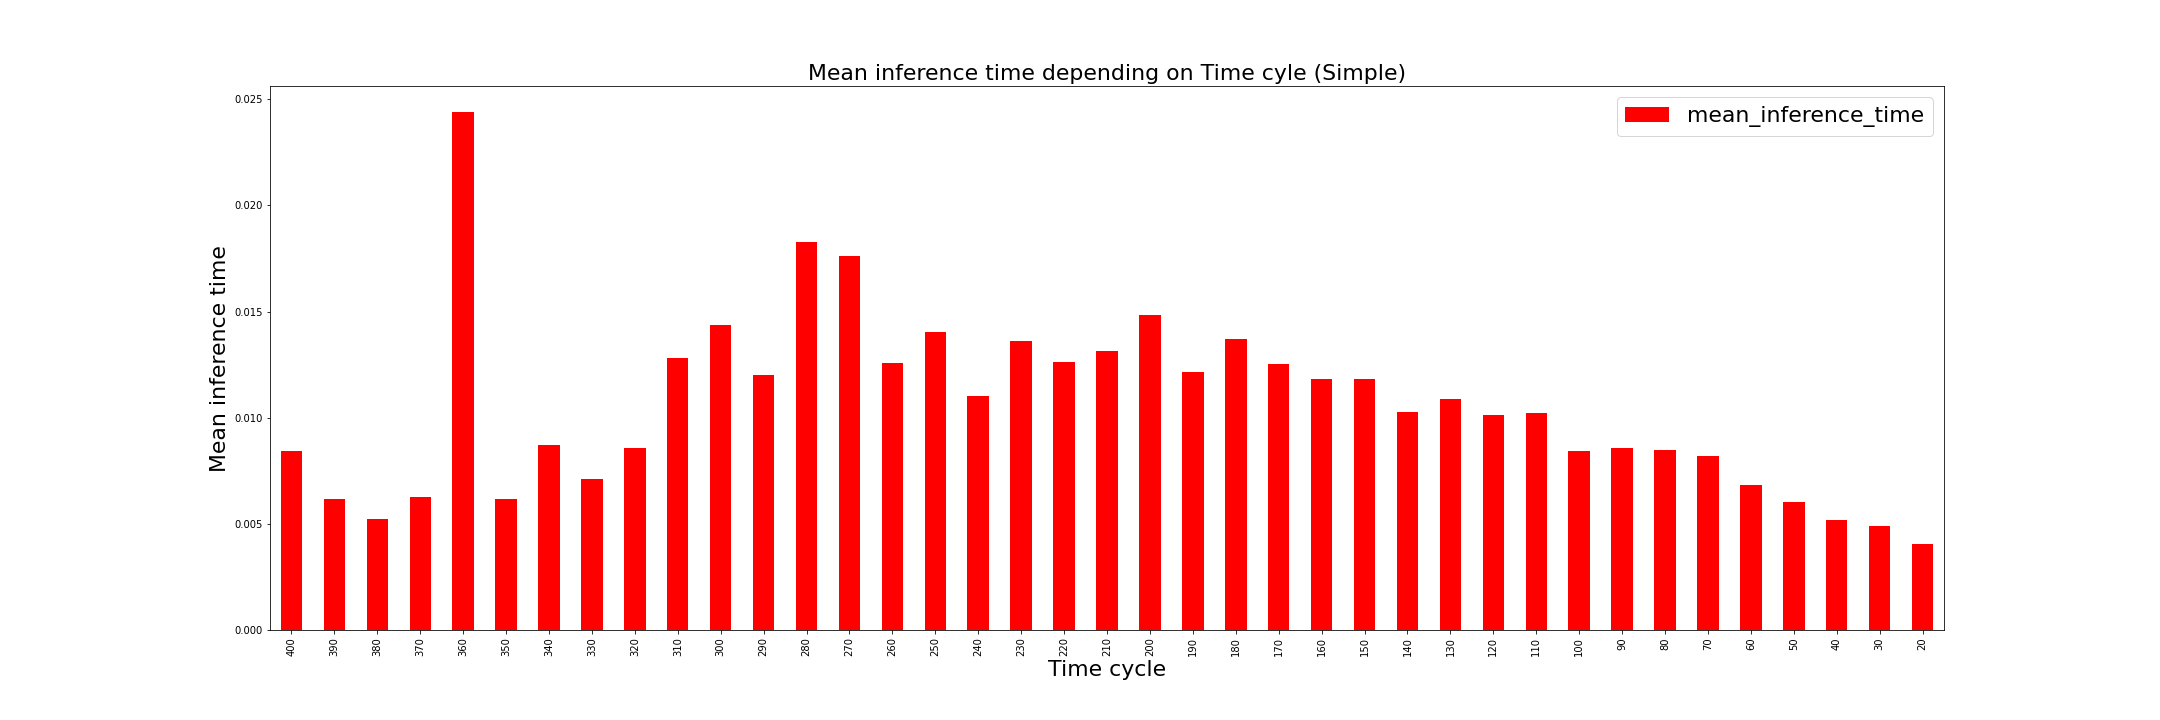
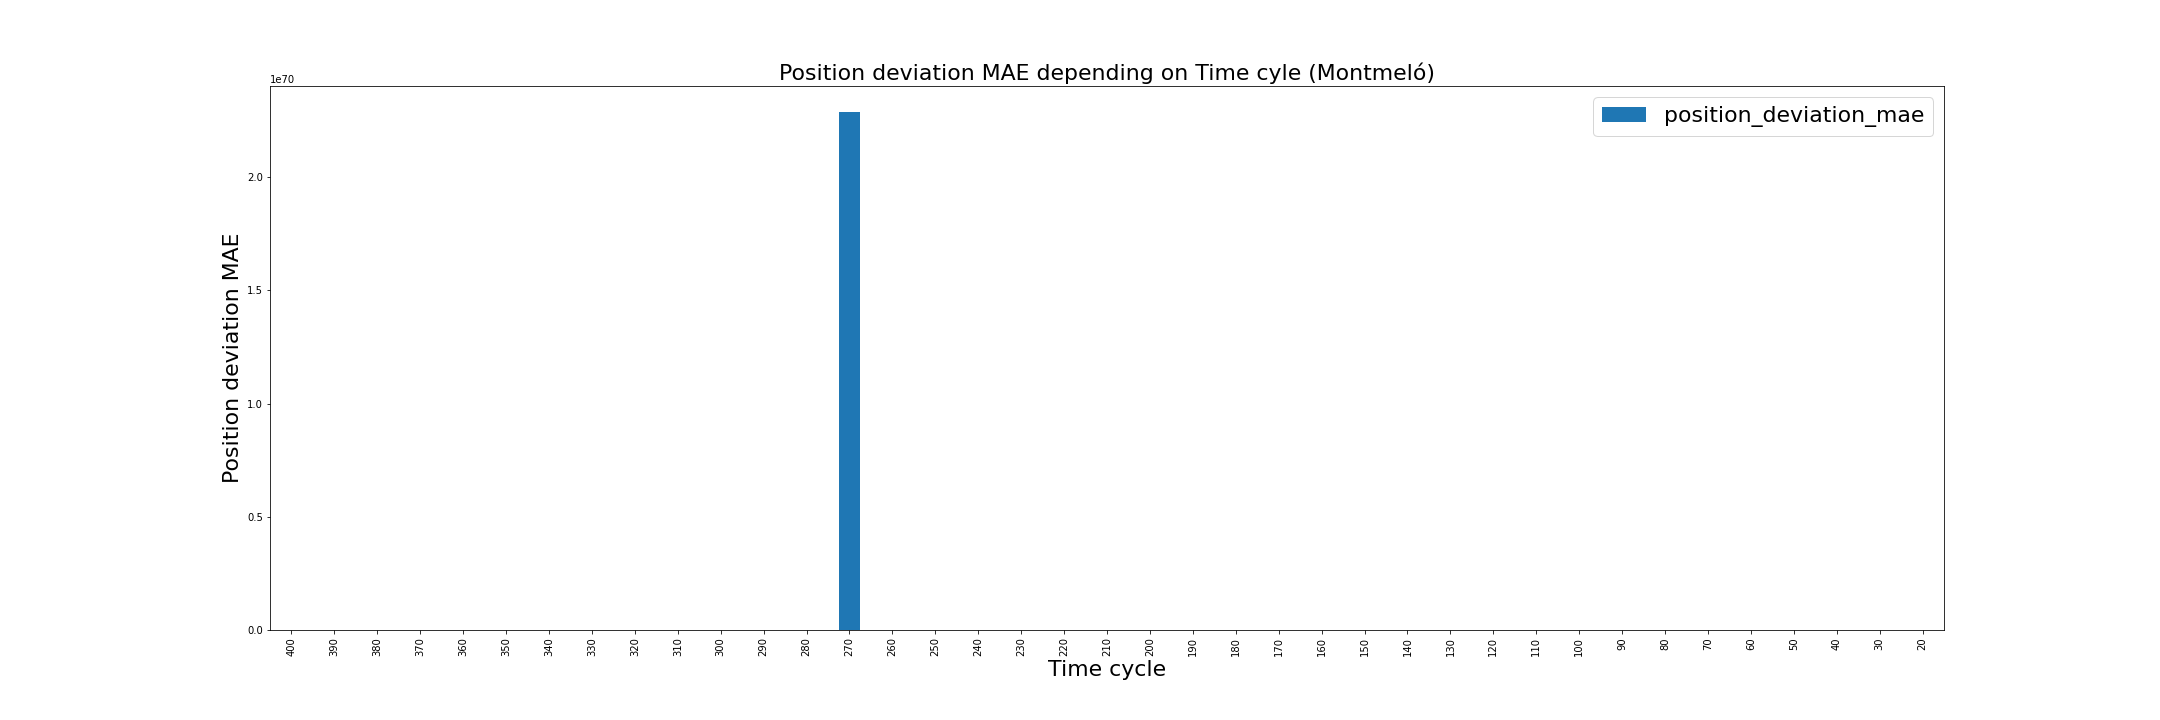
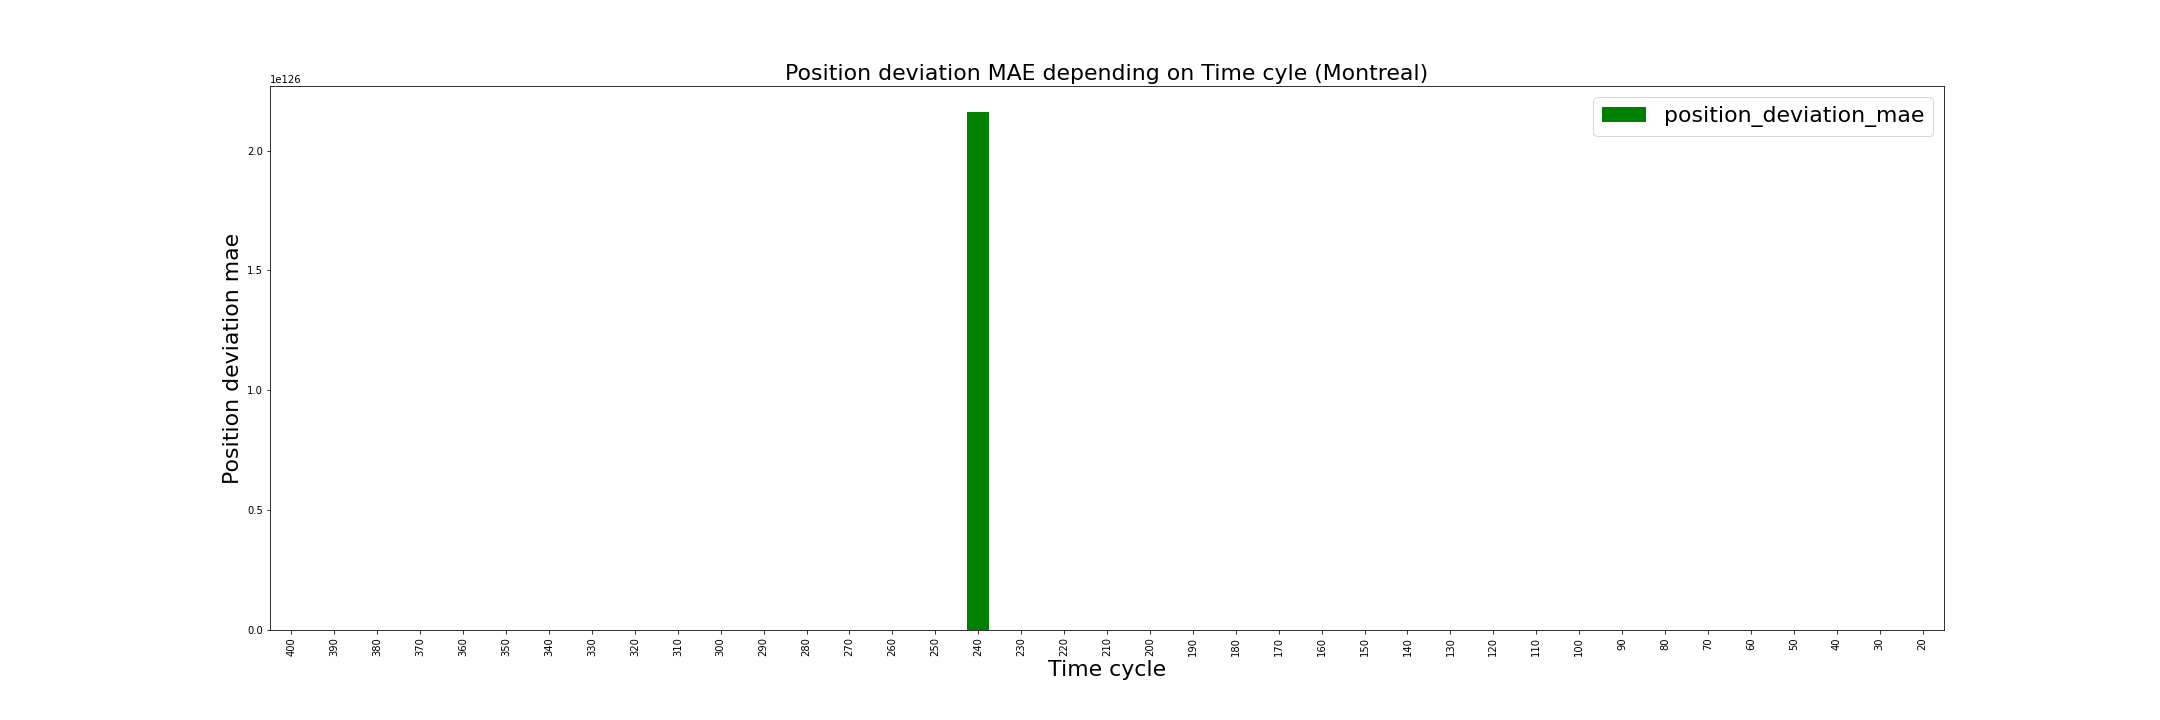
- The performance gets worse when increasing the time per iteration.
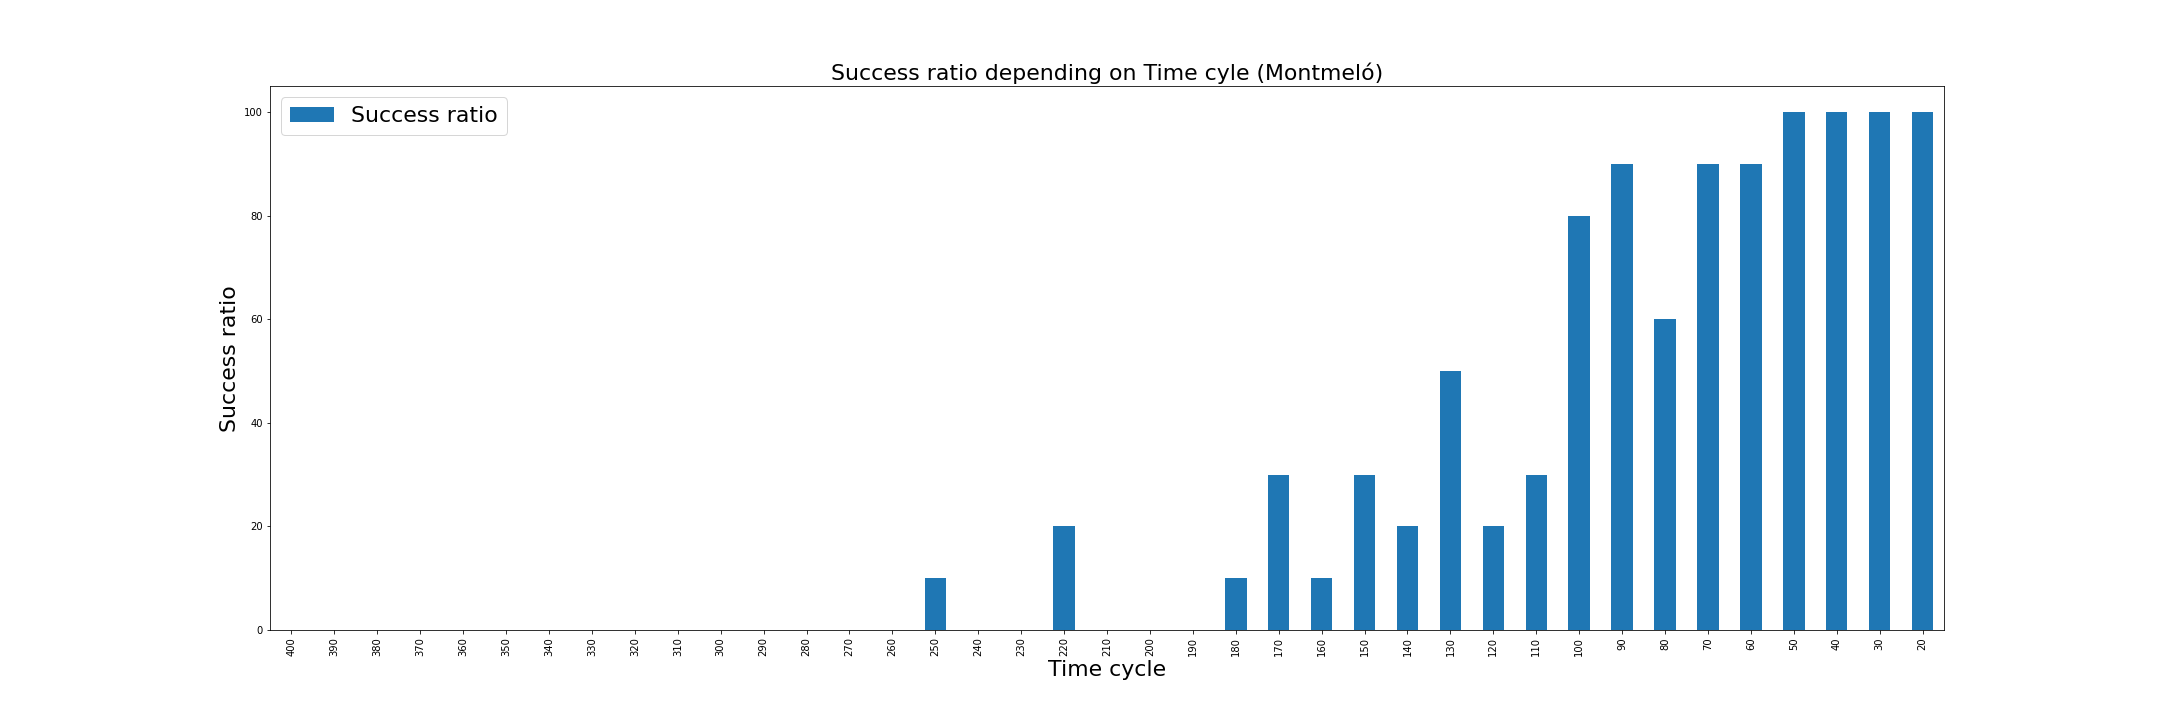
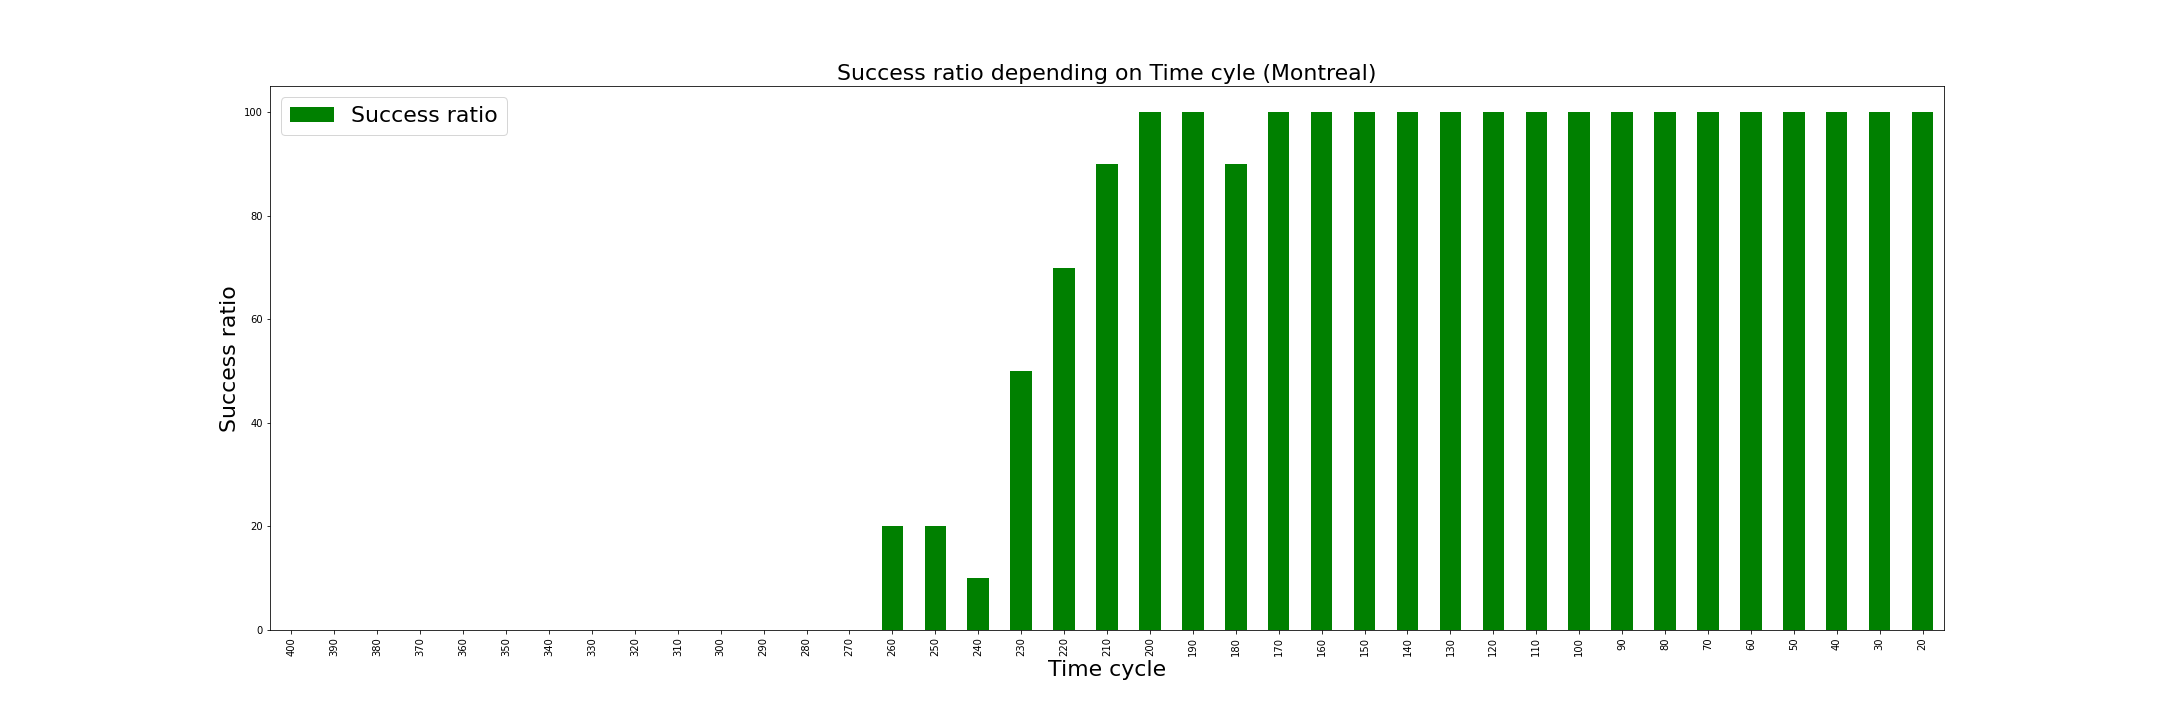
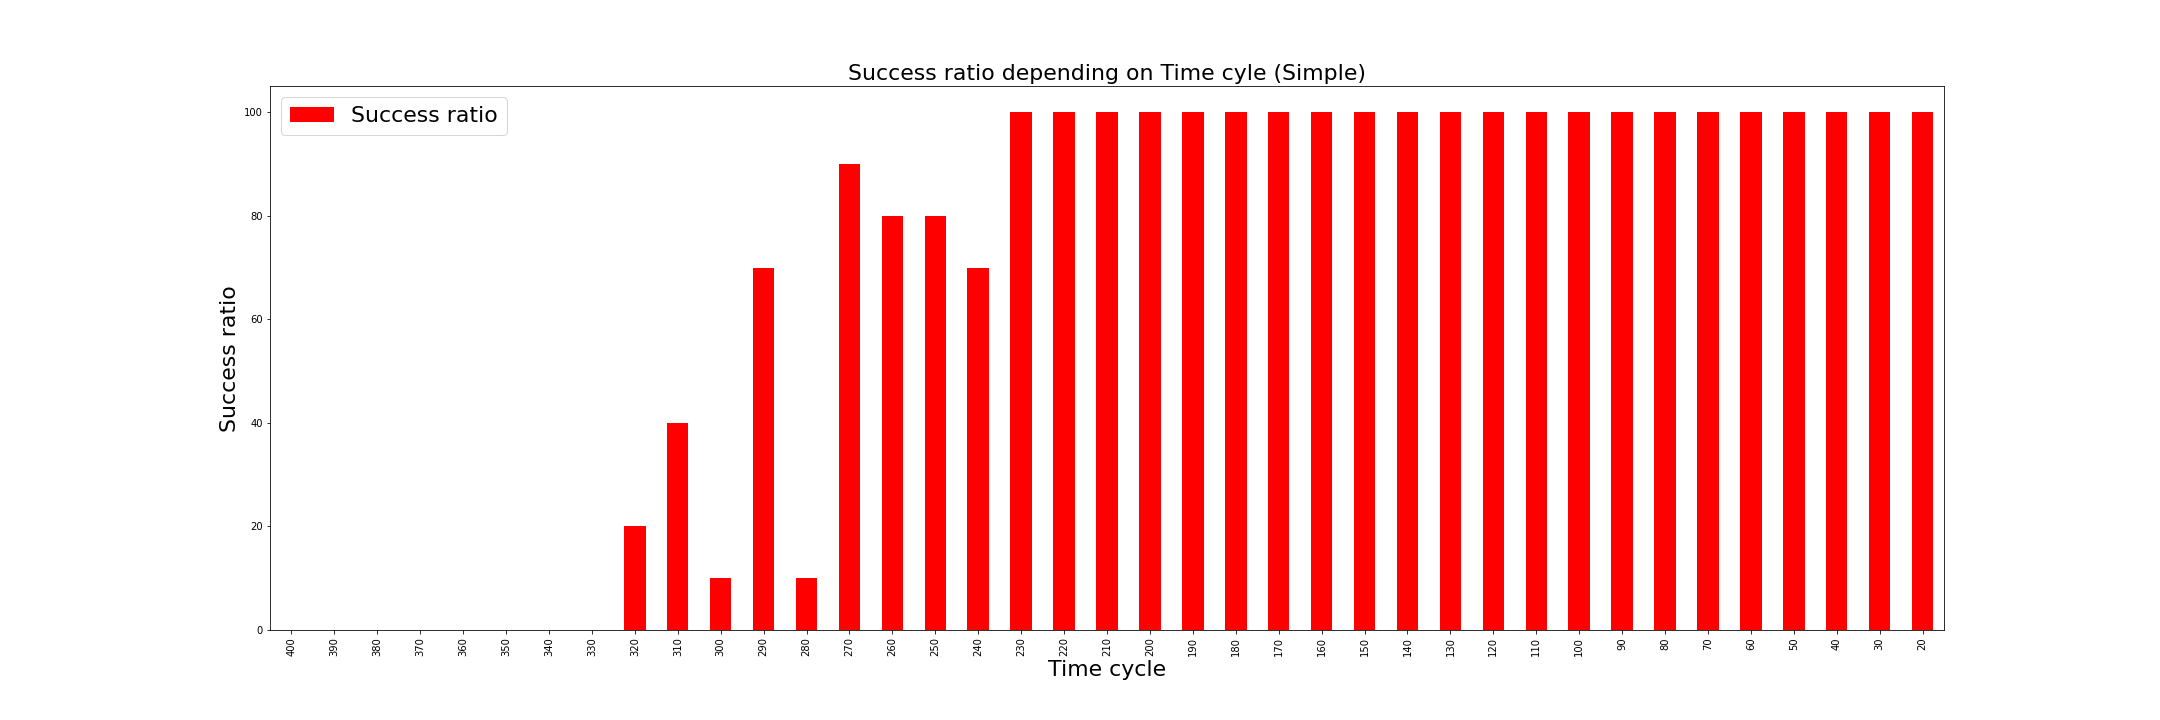
- Circuit shape is key for performance. A more complicated circuit results in worse performance (see success ratio).
- When looking at success ratio, we can see that there is a point where the brains suddenly stop working.
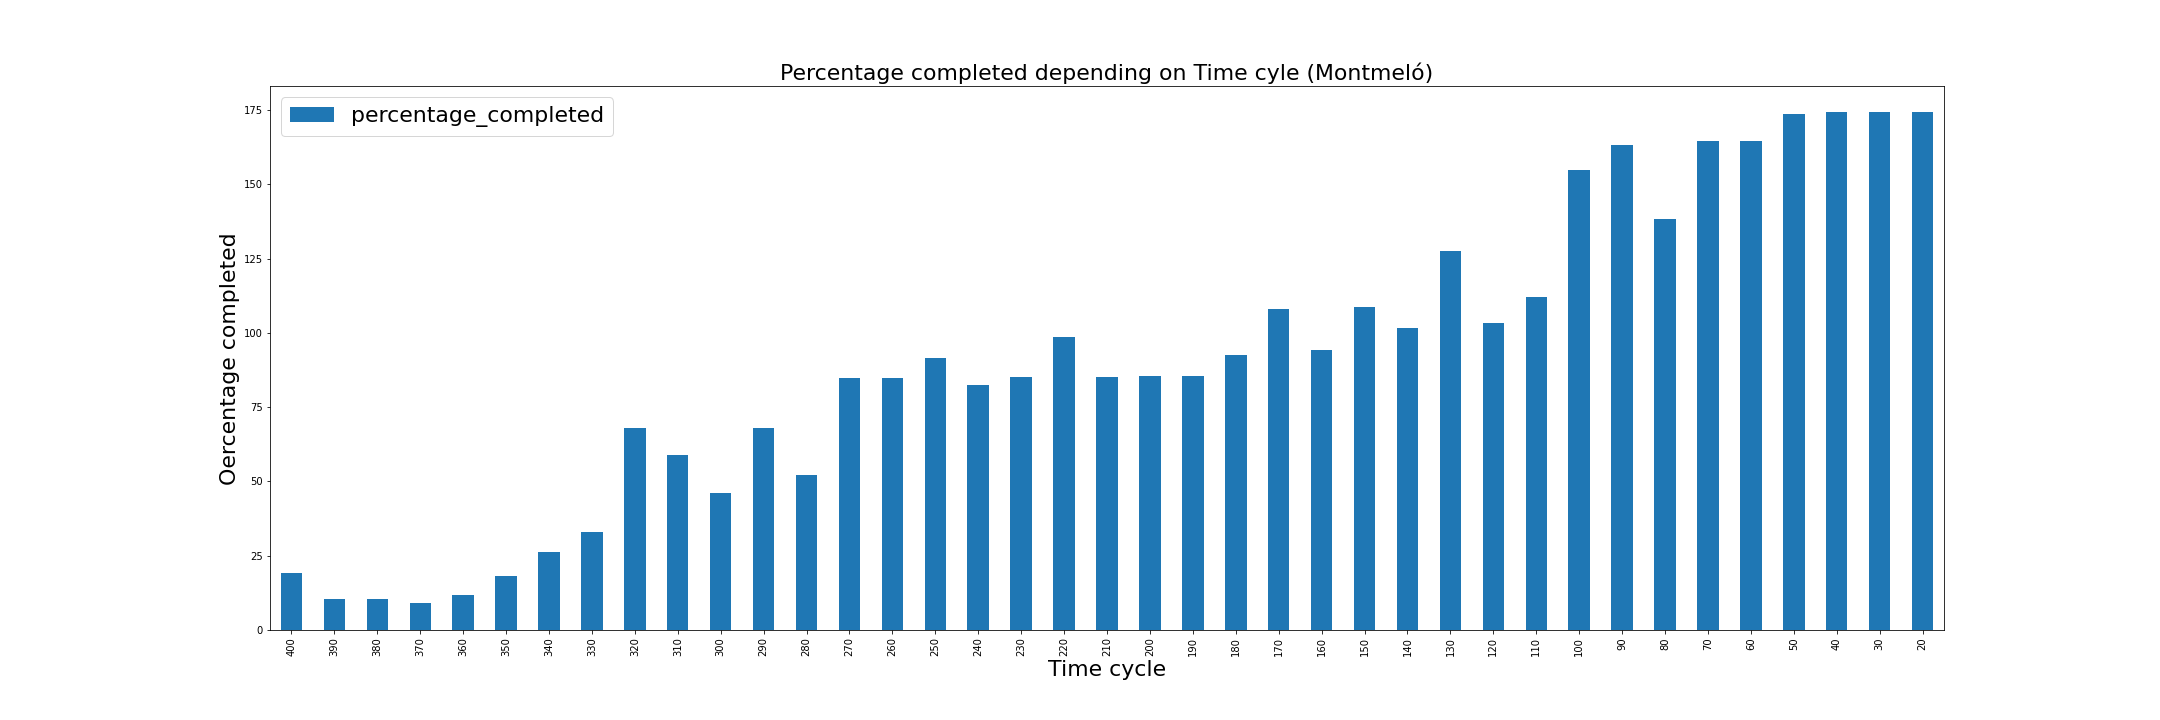
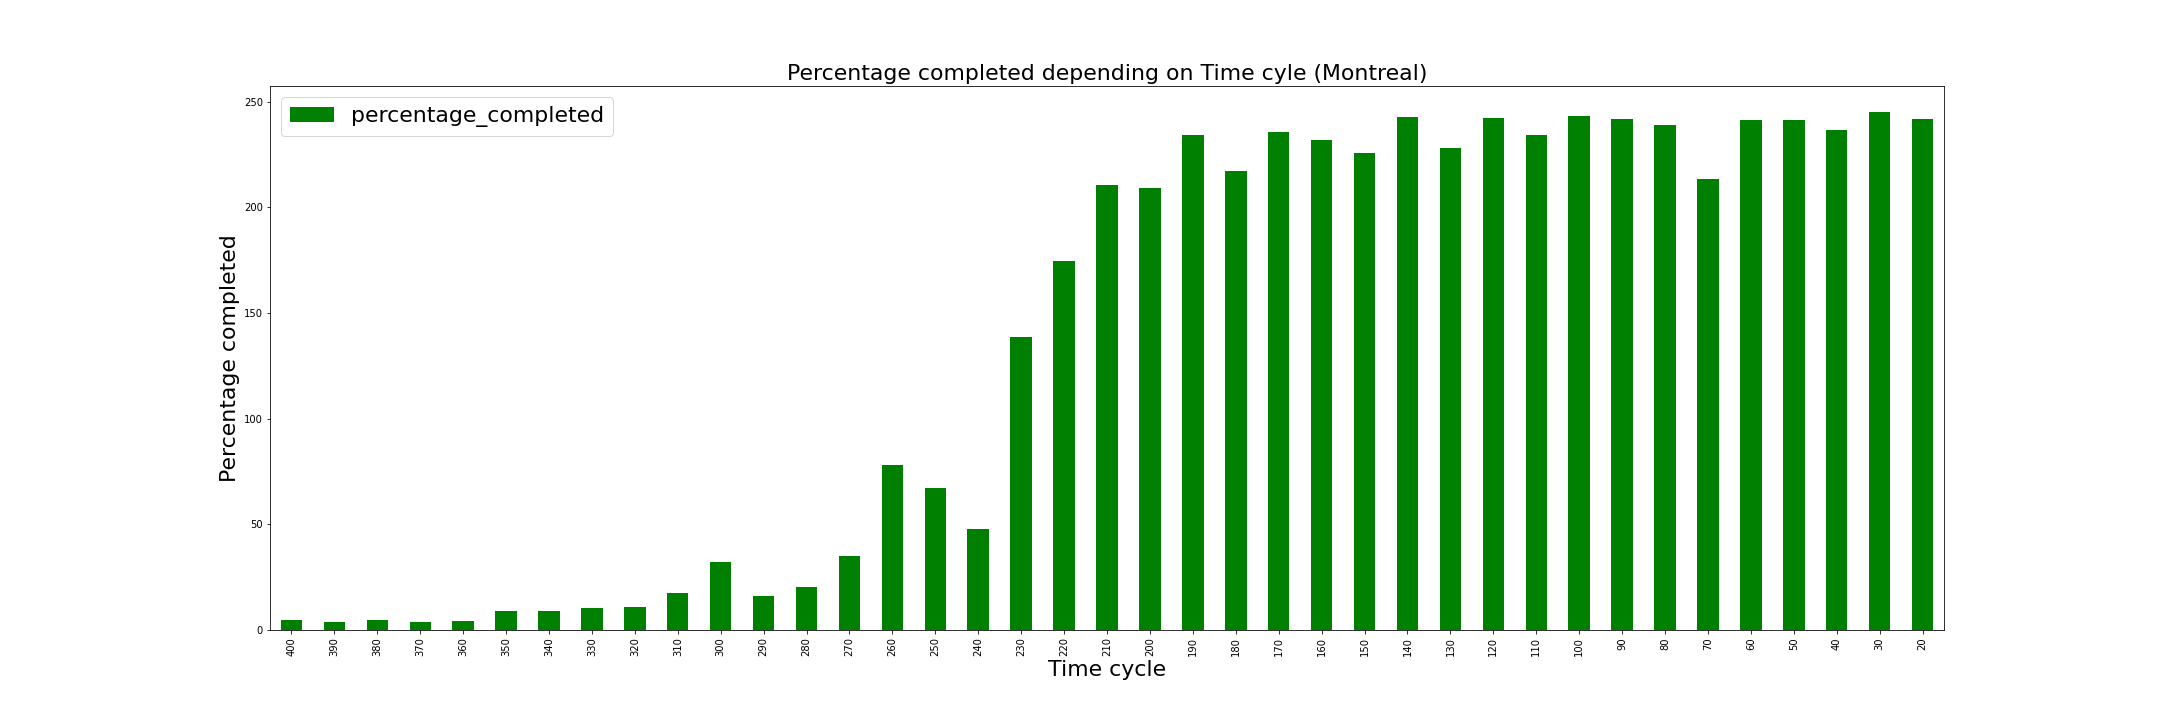
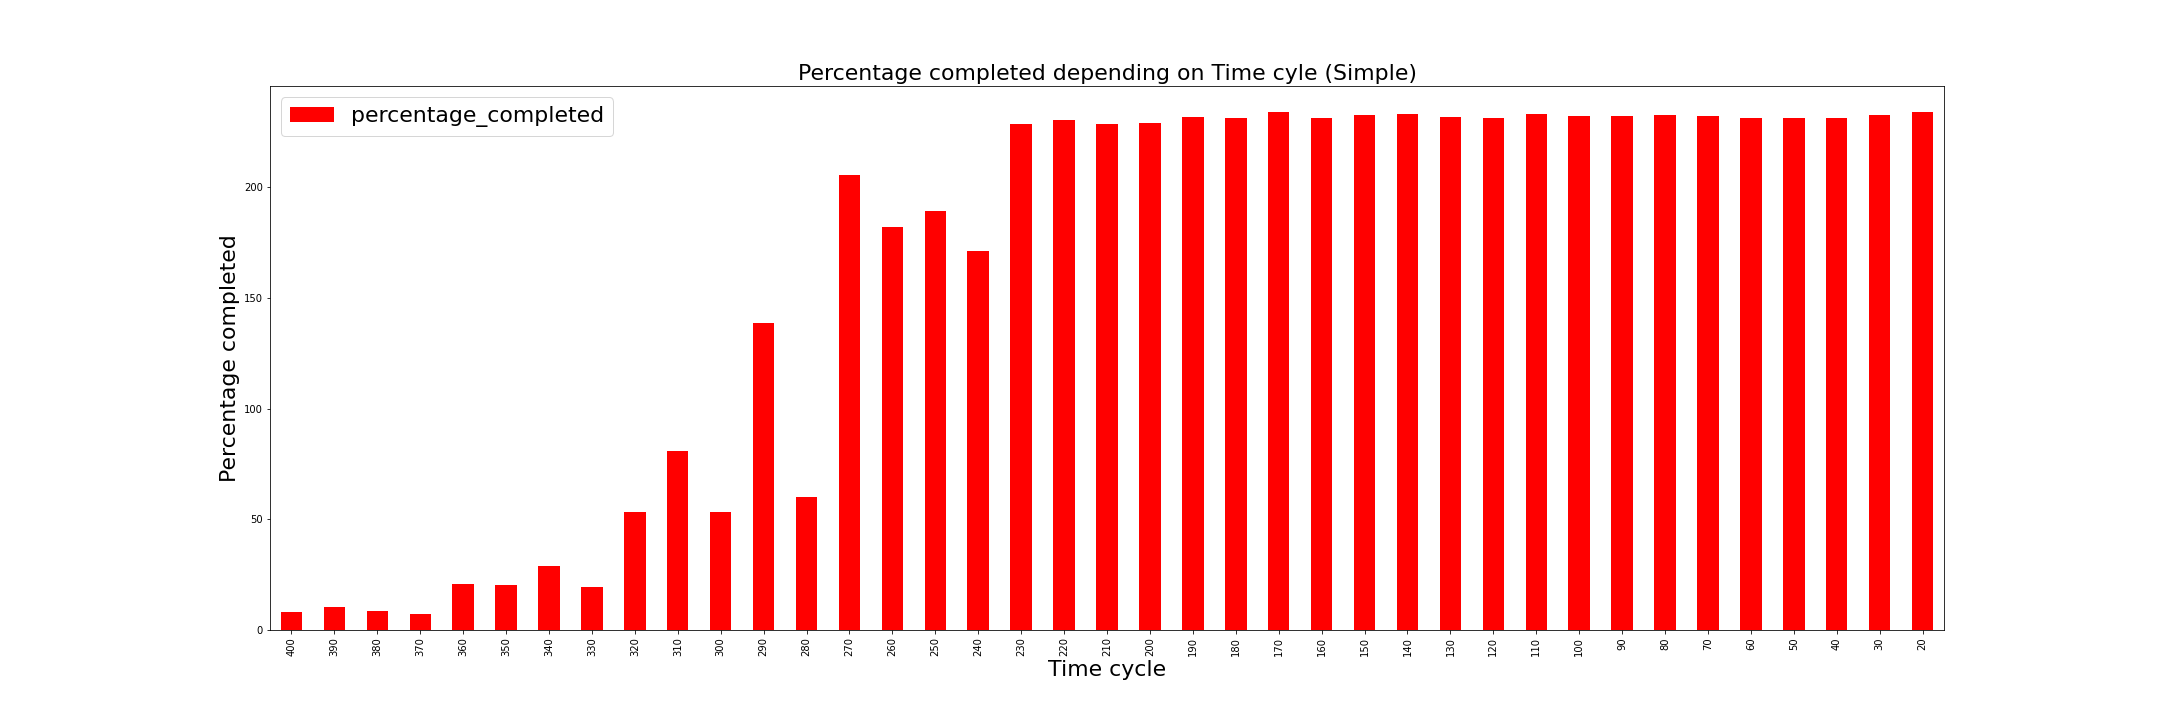
- When looking at completed percentage, this change is more progressive.
Results are shown divided for each circuit.
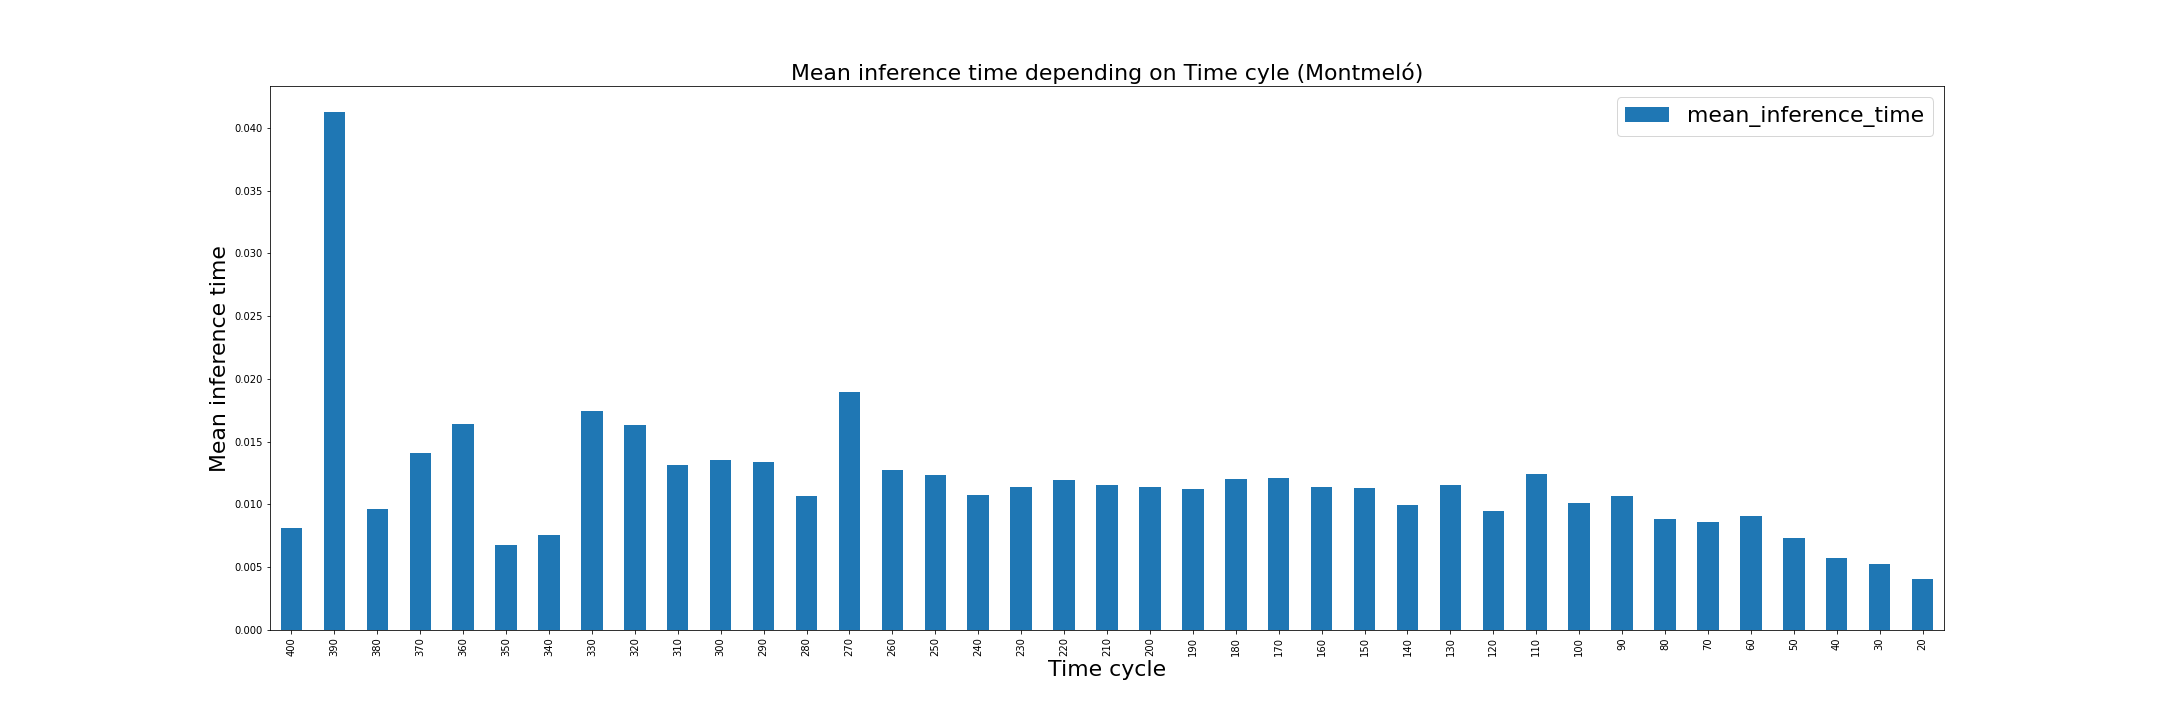
- Blue: Montmeló.
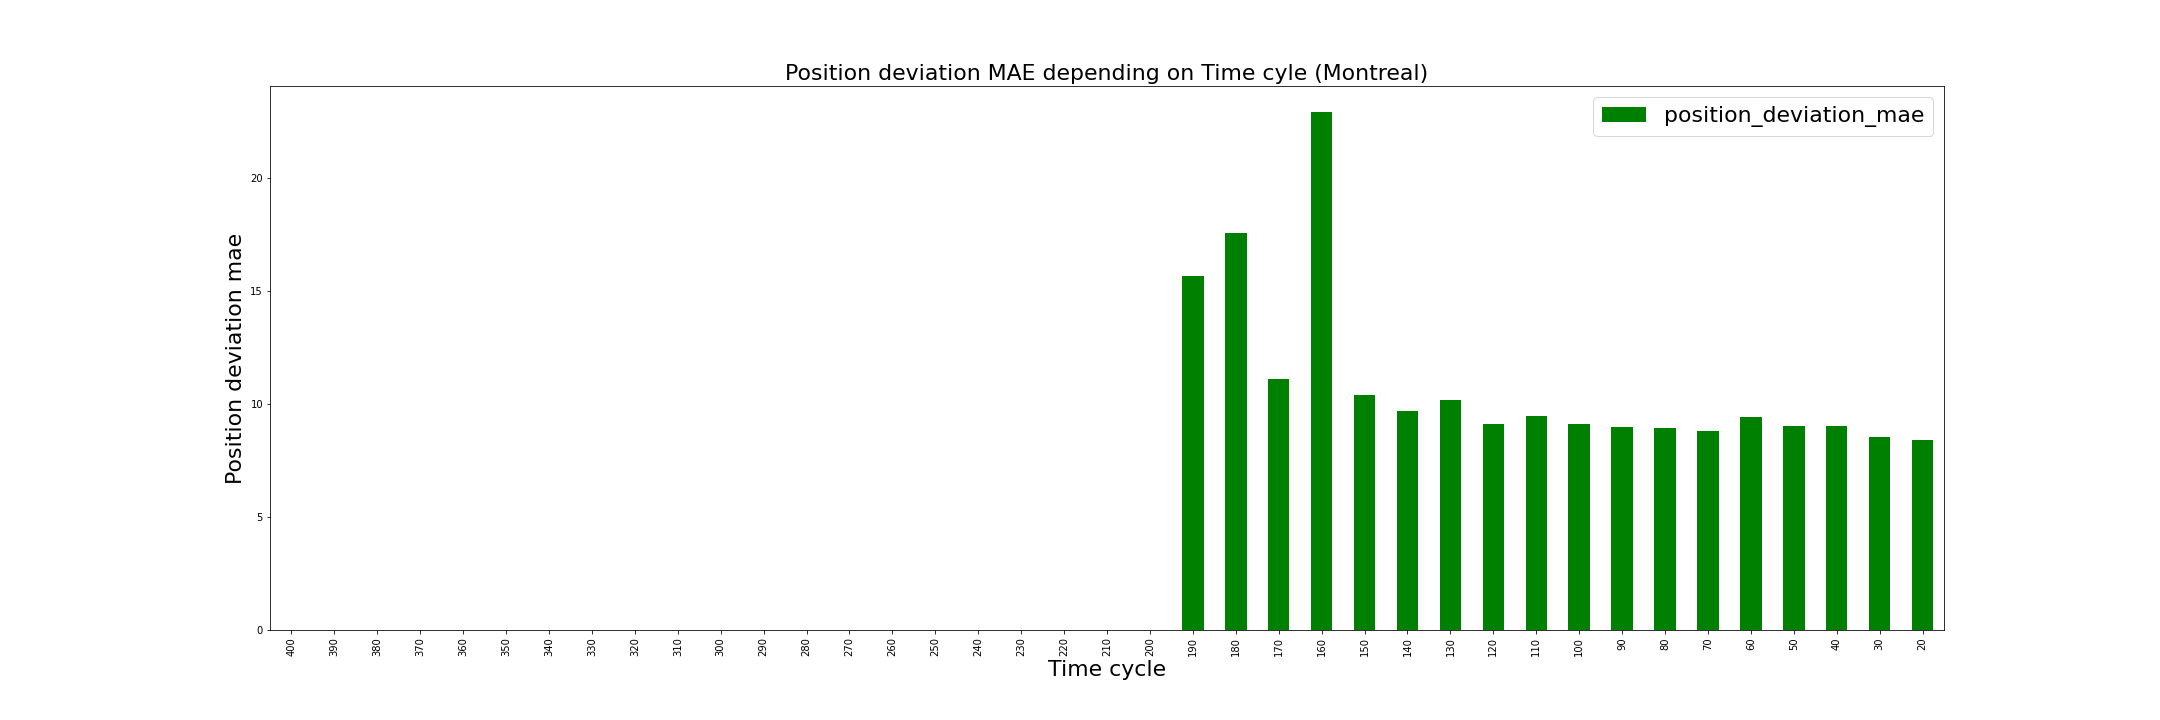
- Green: Montreal.
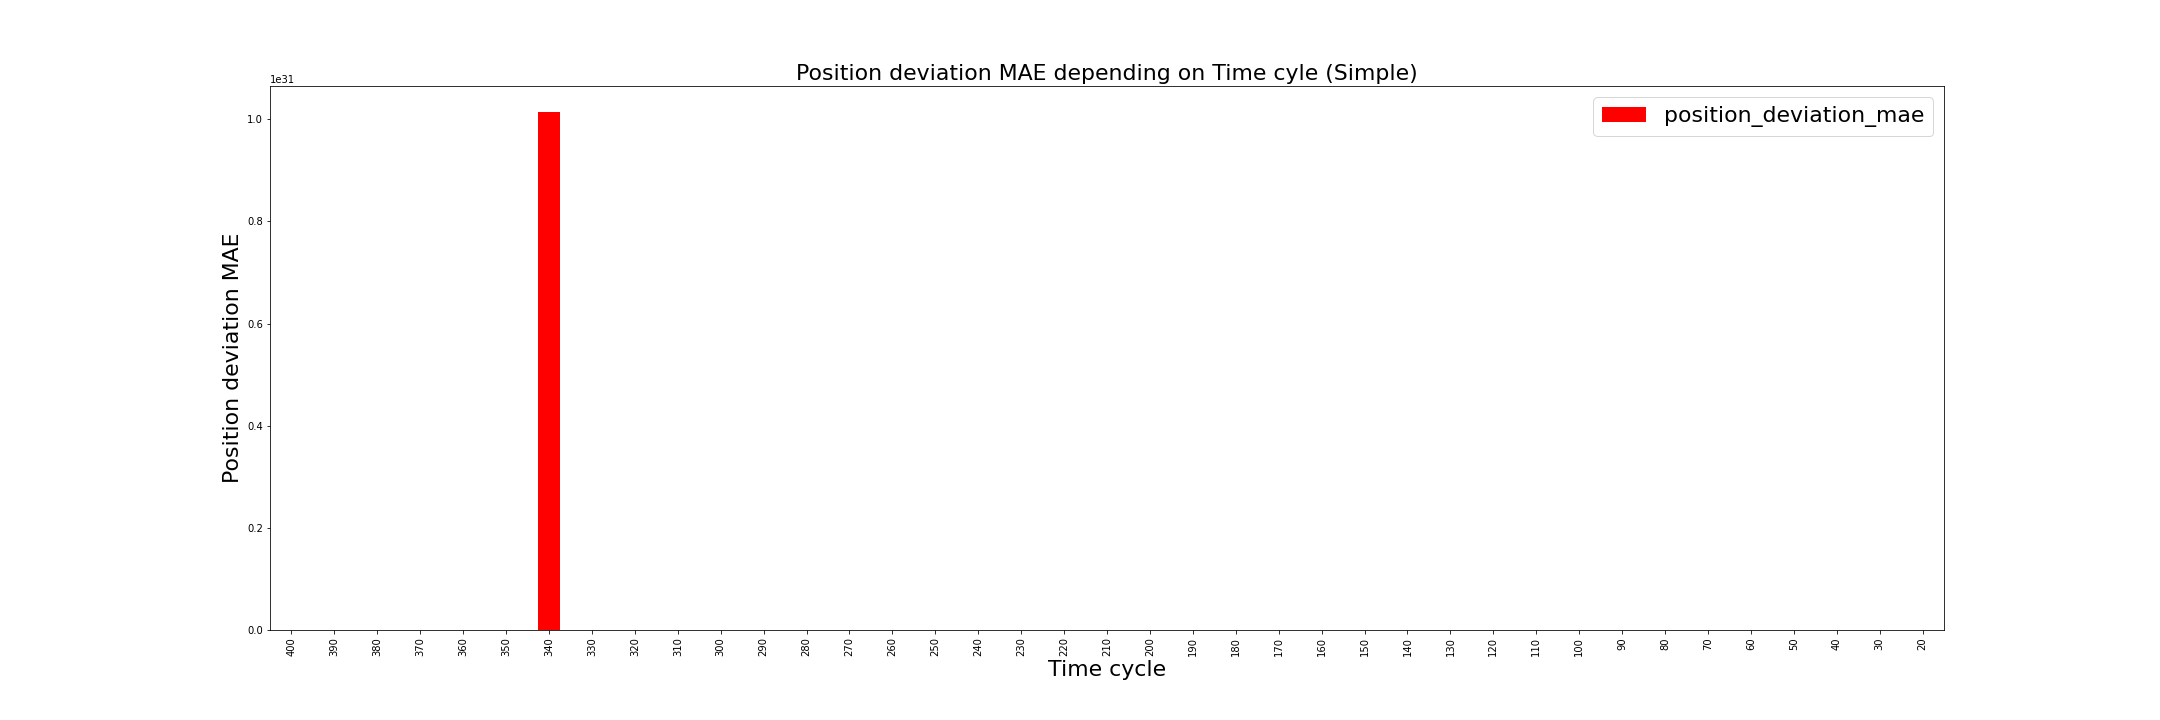
- Red: Simple circuit.
Success ratio for each circuit
Average speed for each circuit
Completed distance for each circuit
Frame rate for each circuit
Lap seconds for each circuit
Mean brain iterations simulated time for each circuit
Mean inference time for each circuit
Percentage completed for each circuit
Position deviation MAE for each circuit
Updated removing max values
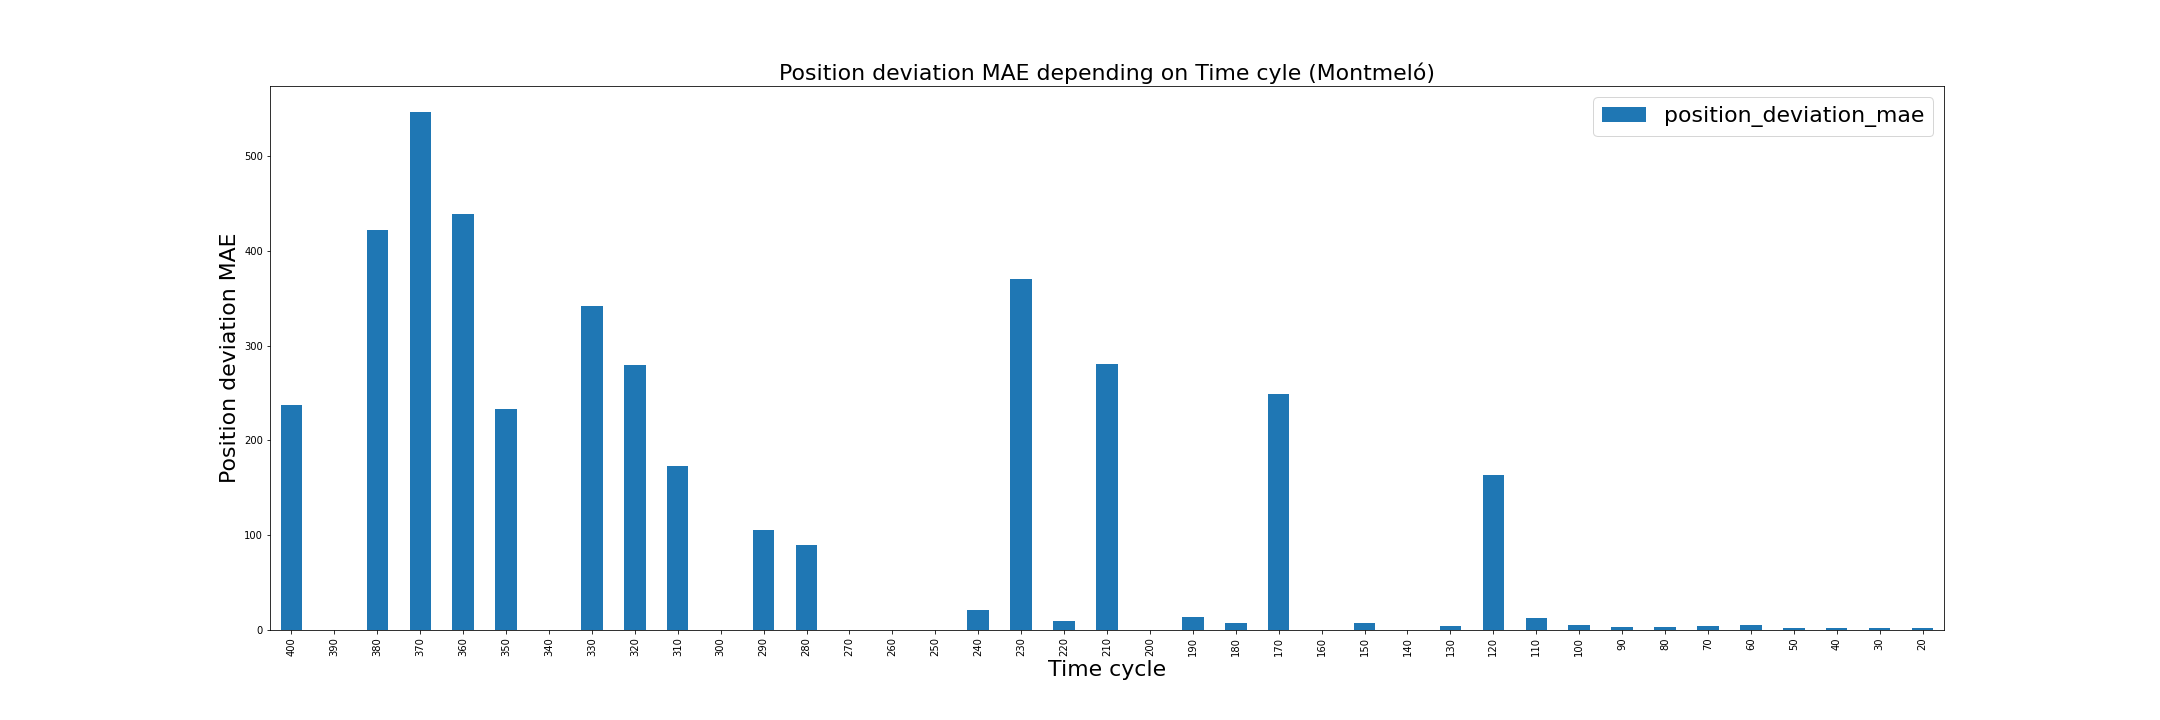
Updated removing max values
Updated removing max values