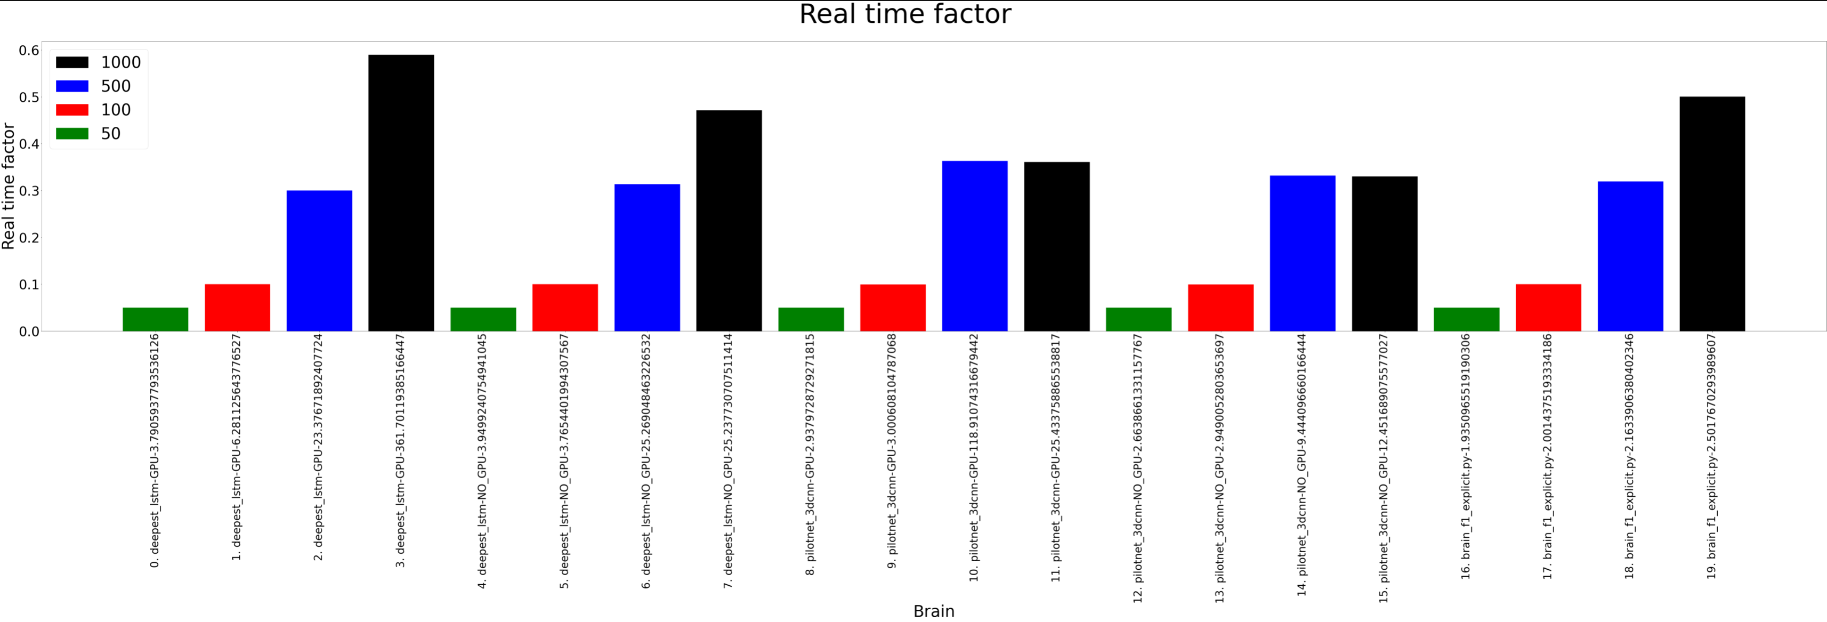
Real time factor comparison
Happy 2022 everyone!
In this new blog post, I explore the importance of Gazebo simulator real time factor and the computational load of the machine in the performance of the brains developed until today.
We have started training brains that accept several images as input at the same time and so we started wondering how this new computation was affecting the overall performance of the simulation and robot control.
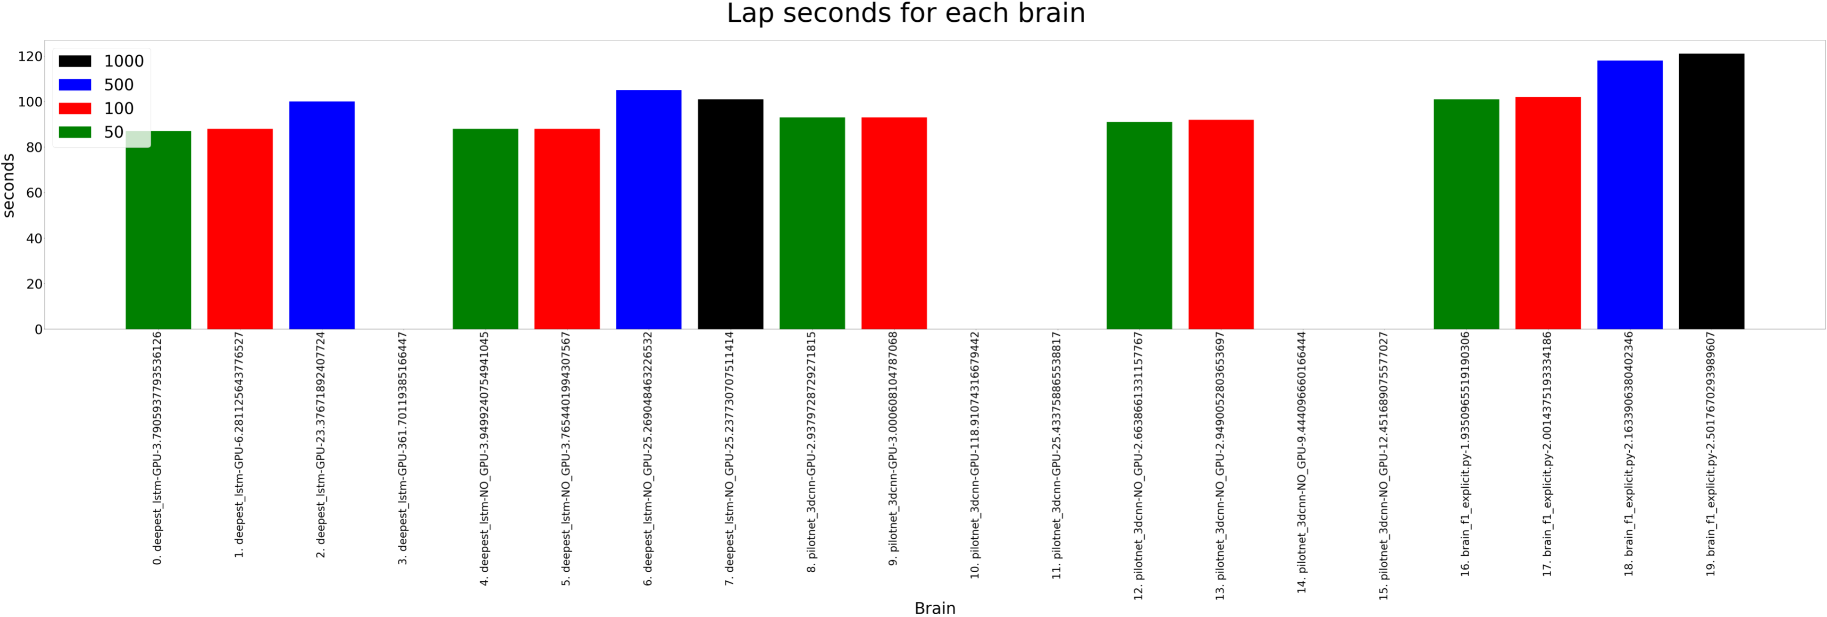
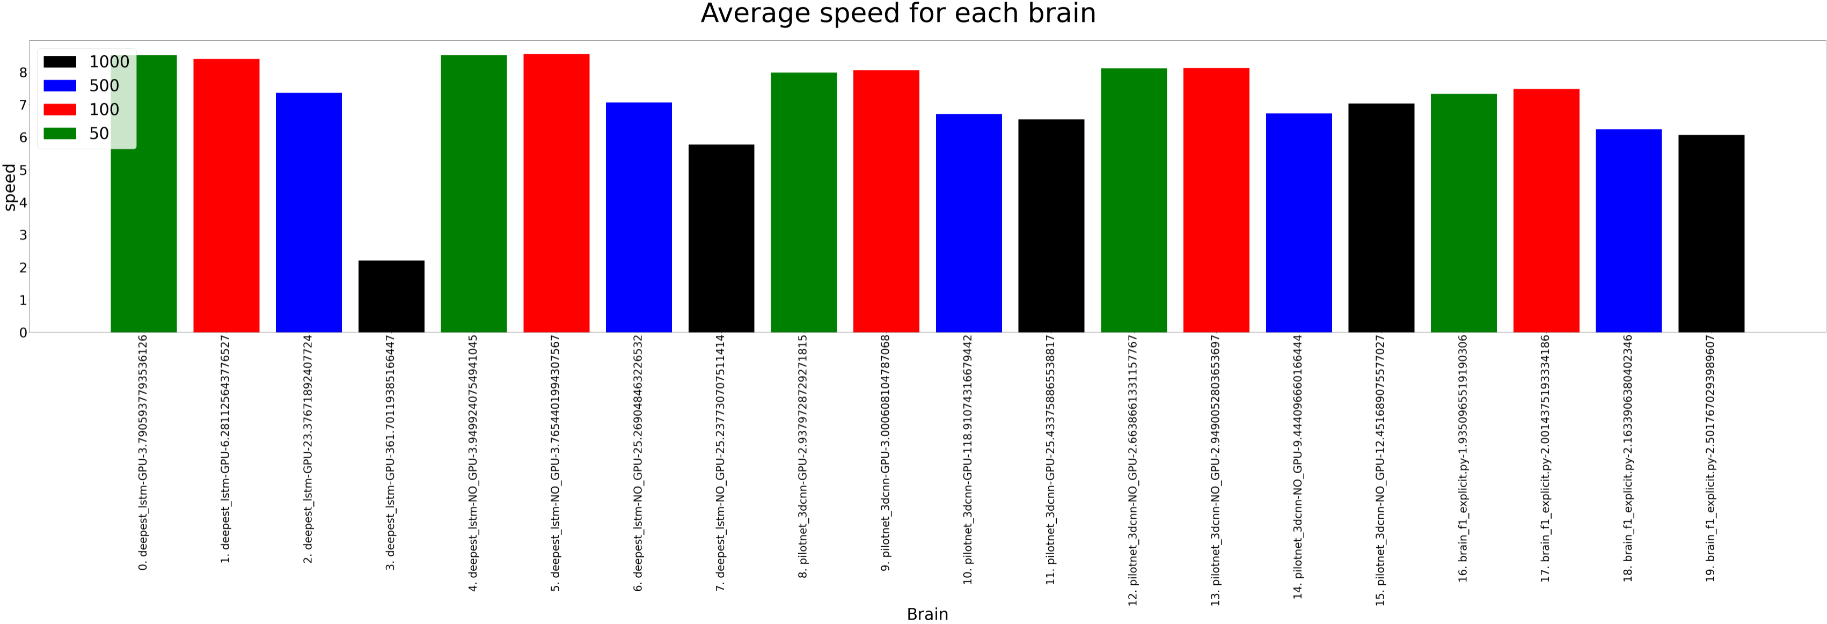
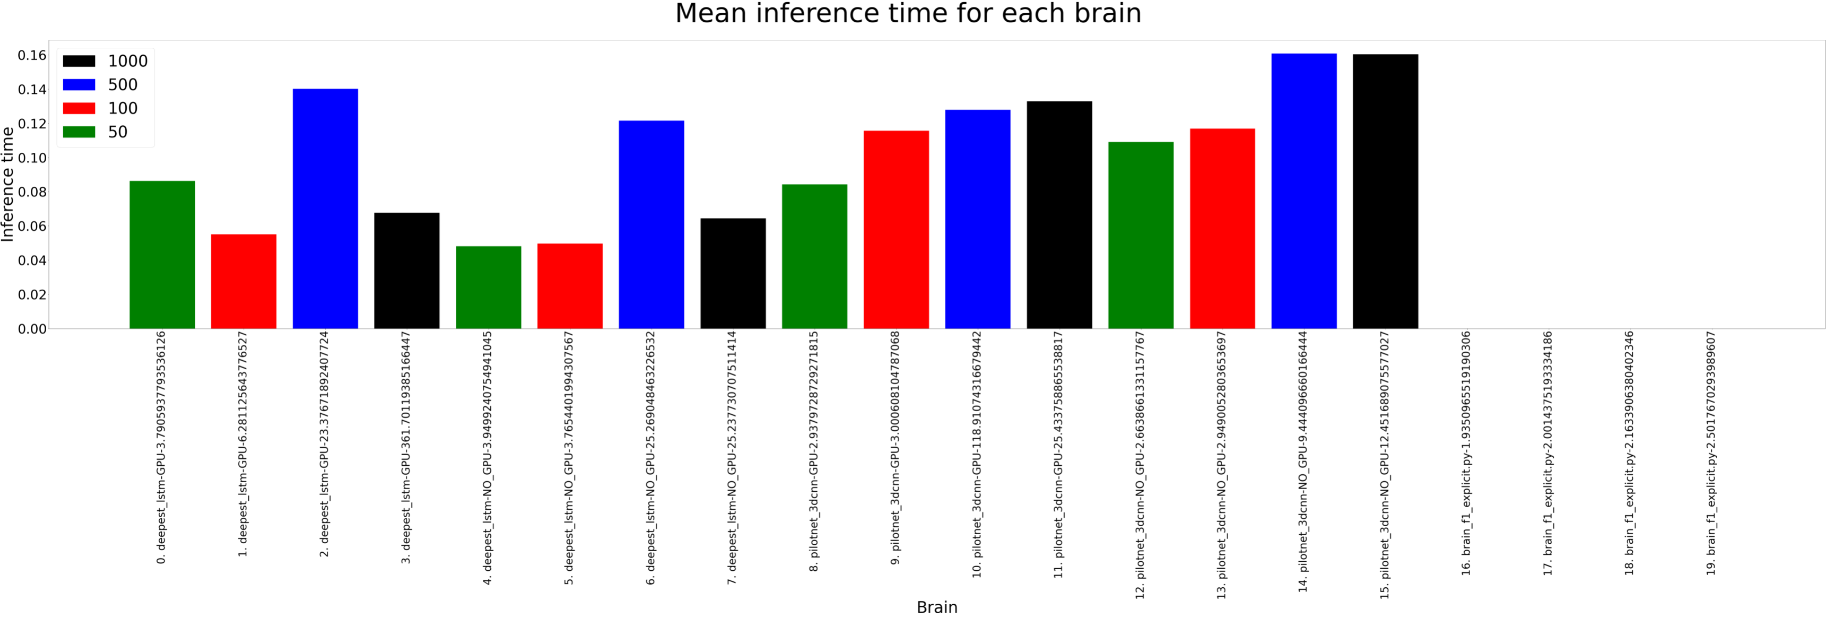
In the following plots, the comparison of the different metrics can be observerd. We compare 3 brains in several scenarios.
The first brain is a Deepest LSTM Tinypilotnet brain, the second one a PilotNet with 3dconv layers that accepts 3 images and the third
brain is a common PID controller. The interesting comparison here is on the Real time update rate factor that modifies the real time factor
of the Gazebo simulation. The modification of this parameter makes the Gazebo simulation faster or slower, varying the computational load depending
on the value used. In this case, we compare 4 values for the parameter: 1000, 500, 100 and 50 (different bar colors). 1000 is the default parameter value on the simulation.
Additionally, we compare the cases where the GPU is used for inference against those where the inference is done using CPU computation.
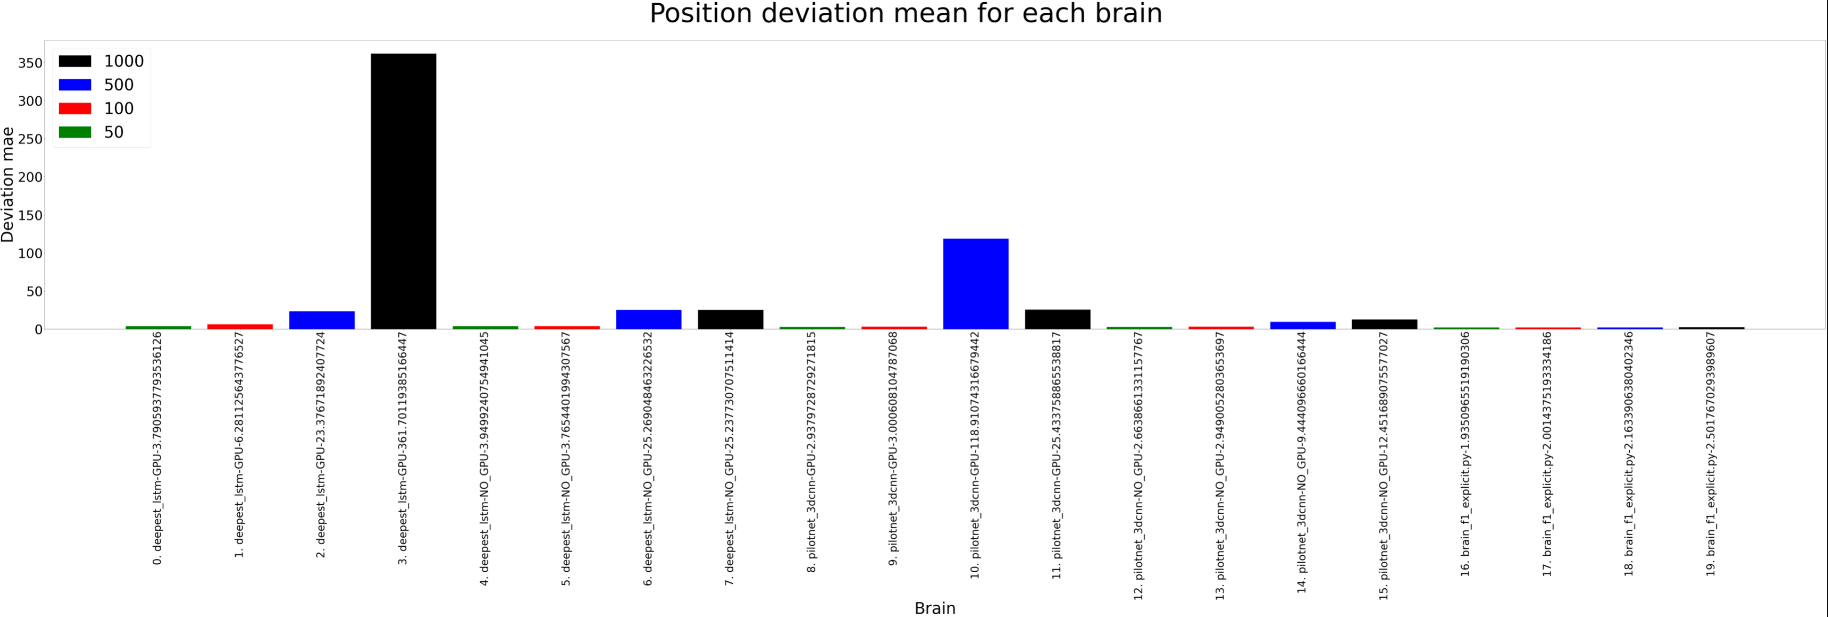
Browsing the plots, we can have some ideas:
- The best
Real time update ratefor our machine is 100. - The GPU vs. CPU battle is won by the CPU. This could be related to the fact that the inference is done 1 image at a time, so we are not using the GPU capabilities.
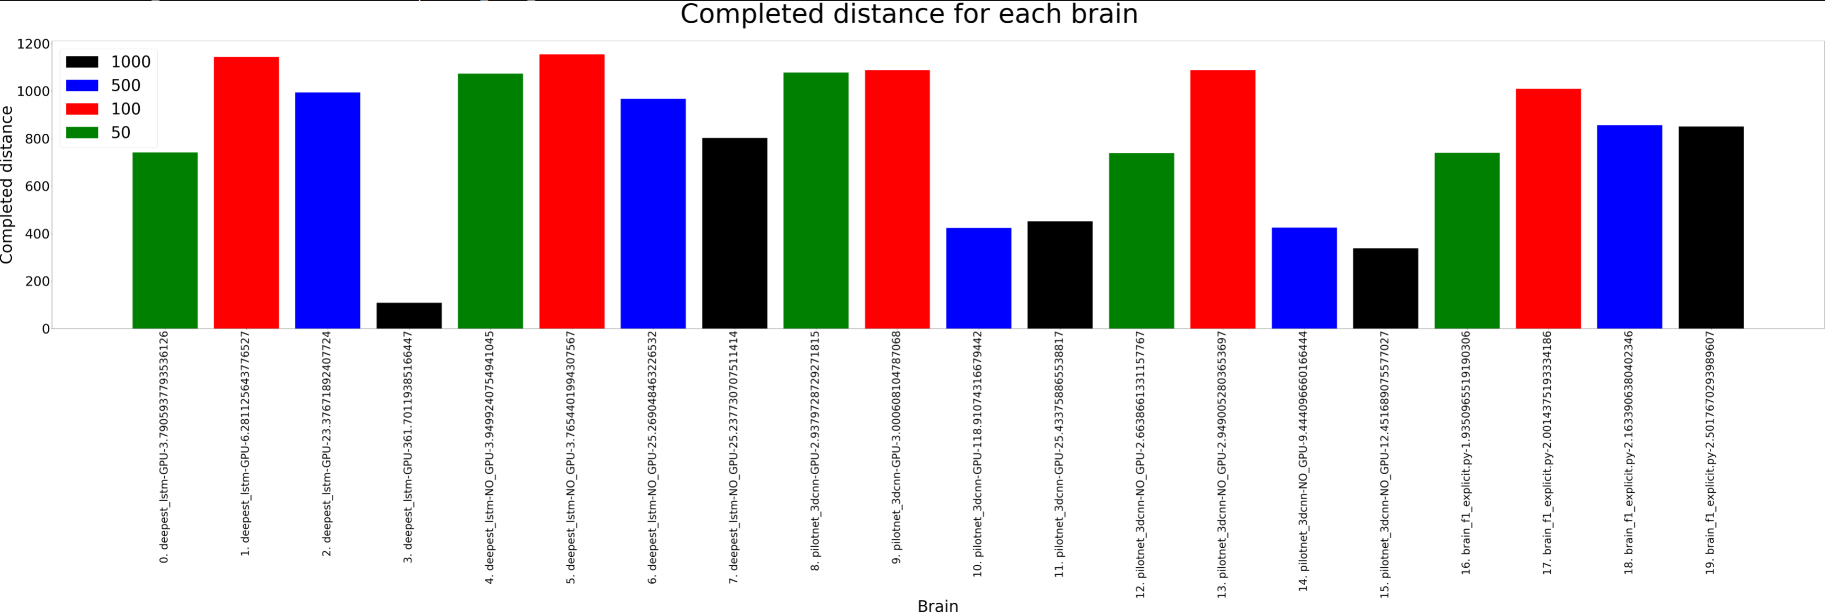
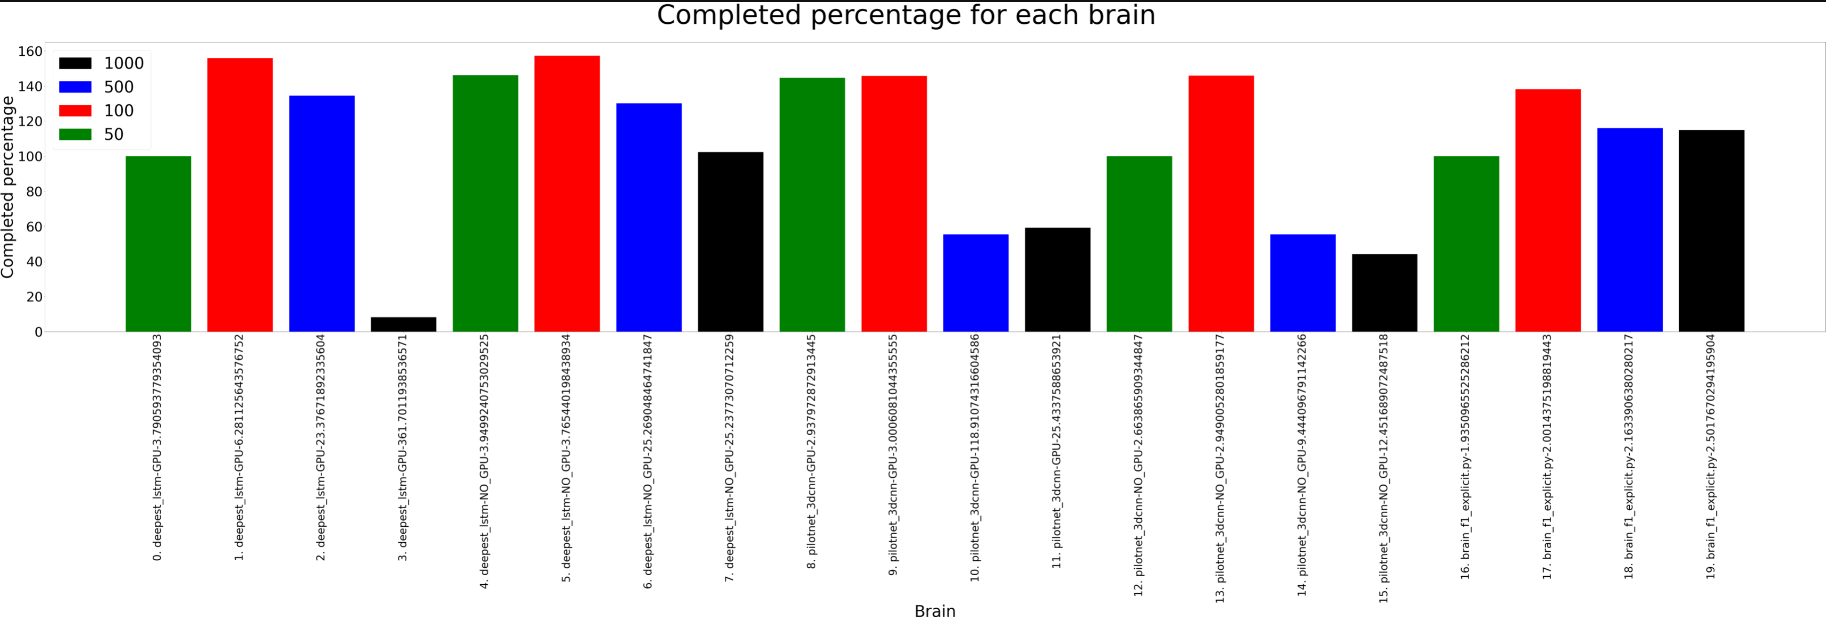
- The neural brains already complete Montmeló when the
Real time update rateis 100. This fact means that our machine computation load is too high to handle the simulation and execution of the brain on the default settings. Since we are using simulation, we can do this trick but if we want to use the brains on a real robot we should consider this issues. - When the
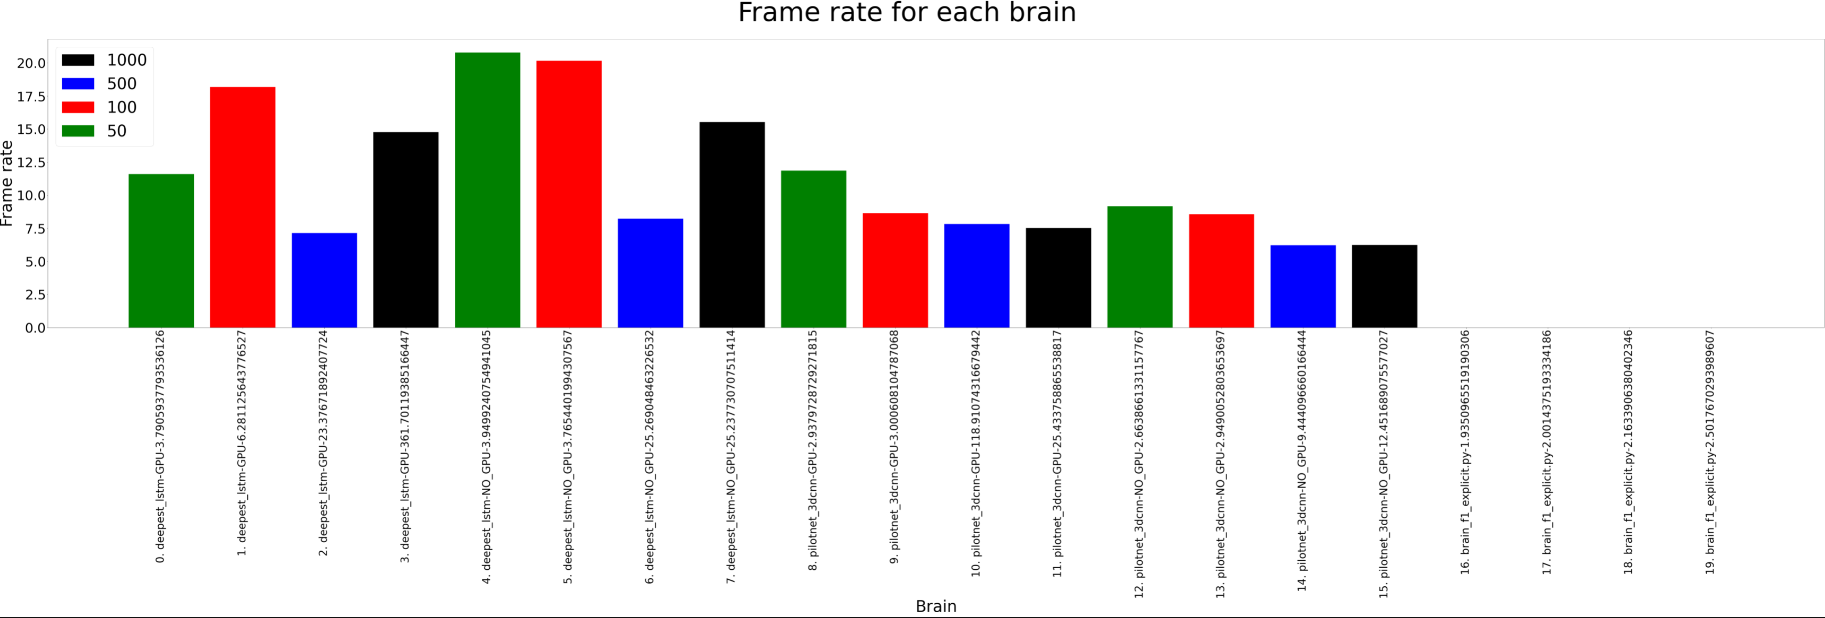
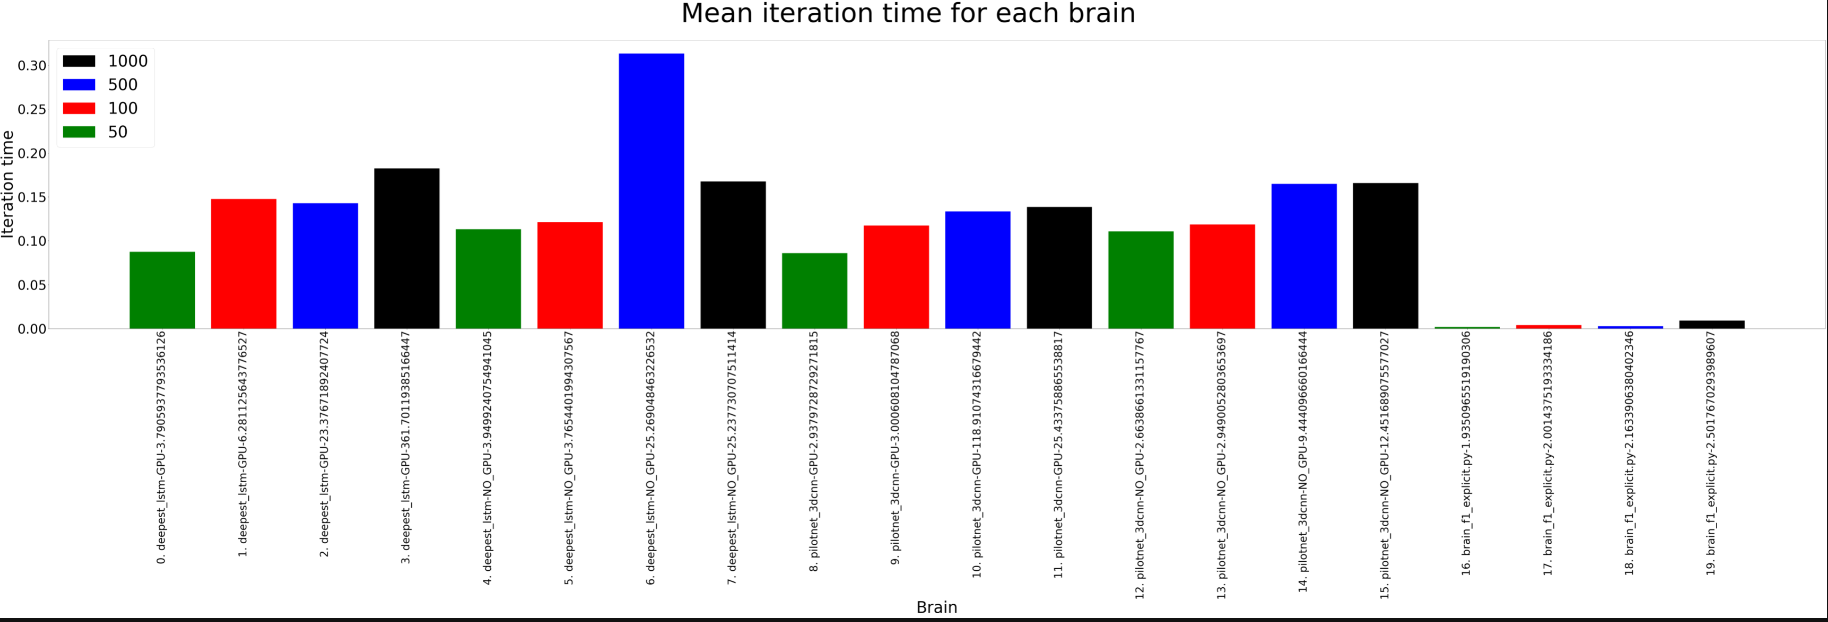
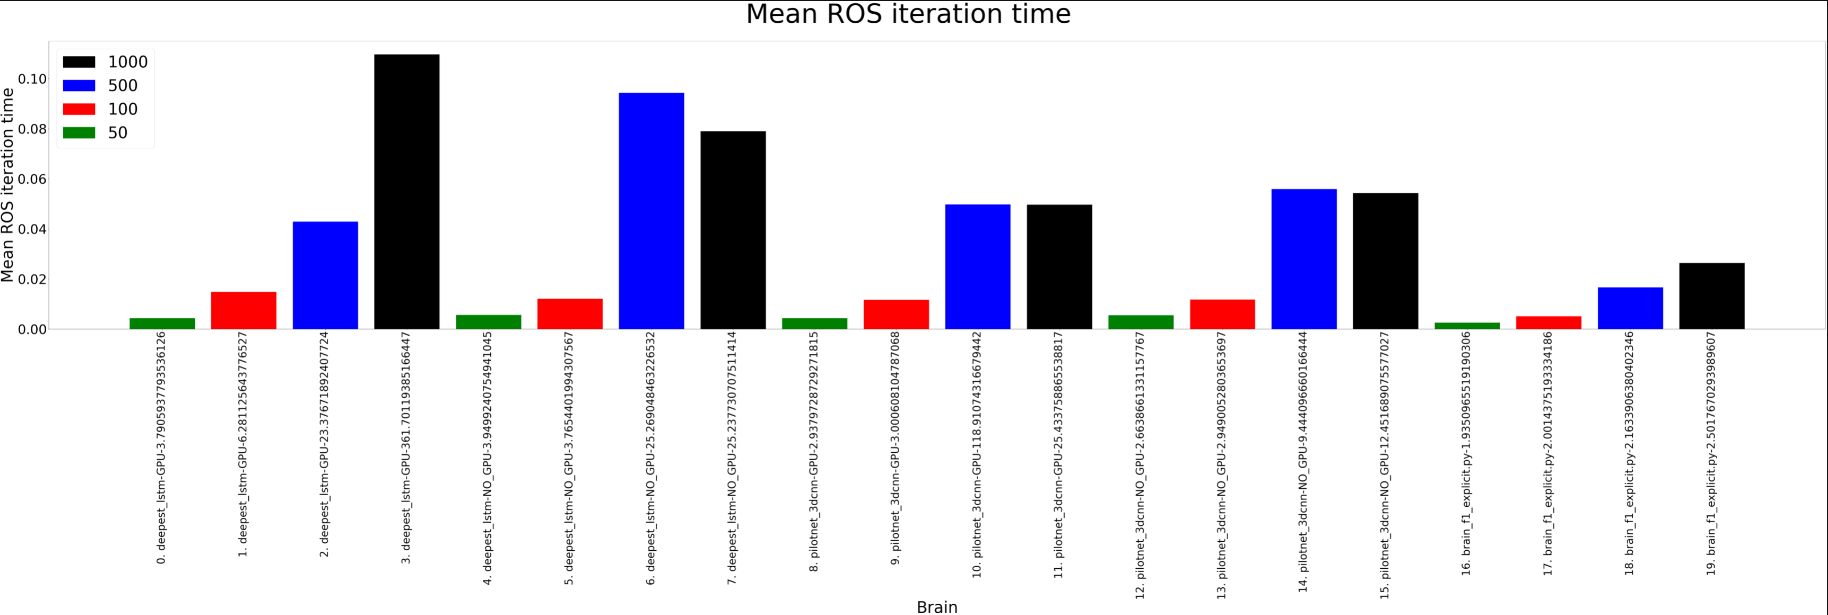
Real time update rateis lower, the brain is able to complete Montmeló faster and with better position deviation error. - The more iterations of the brain the better it performs. When the
Real time update rateis 100 or lower, the neural brains are able to achieve 10 iterations of the brain per second, enough for this control task.
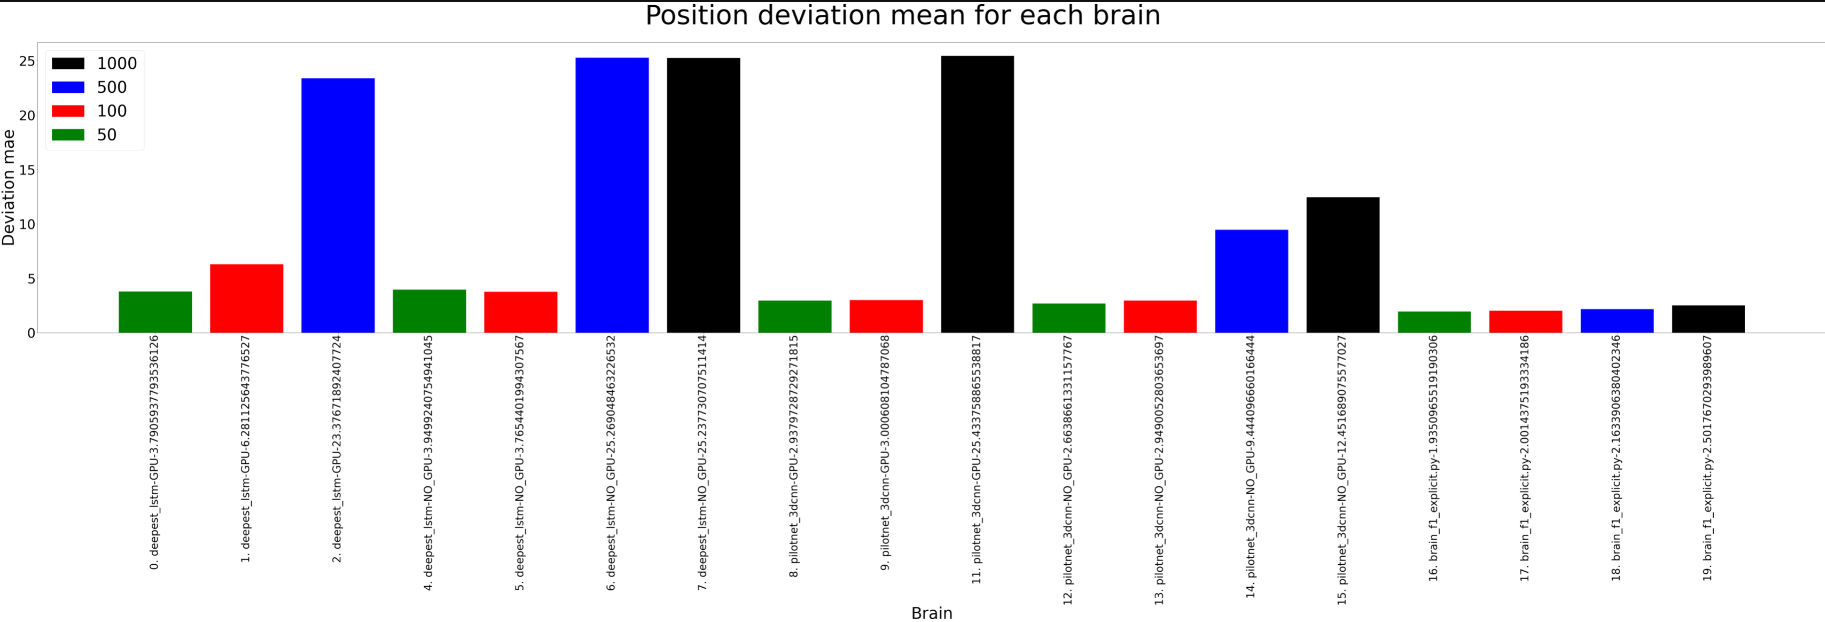
Detail of position deviation
In this plot, a detail of the position deviation values is shown, removing one value that was different.
The plot shows that the Real time update rate plays an important role in the simulations, when it’s 100 or lower, the
performance of the different brains is close to the same.