Testing RLidar and Scenarios
Index
Using RLIDAR
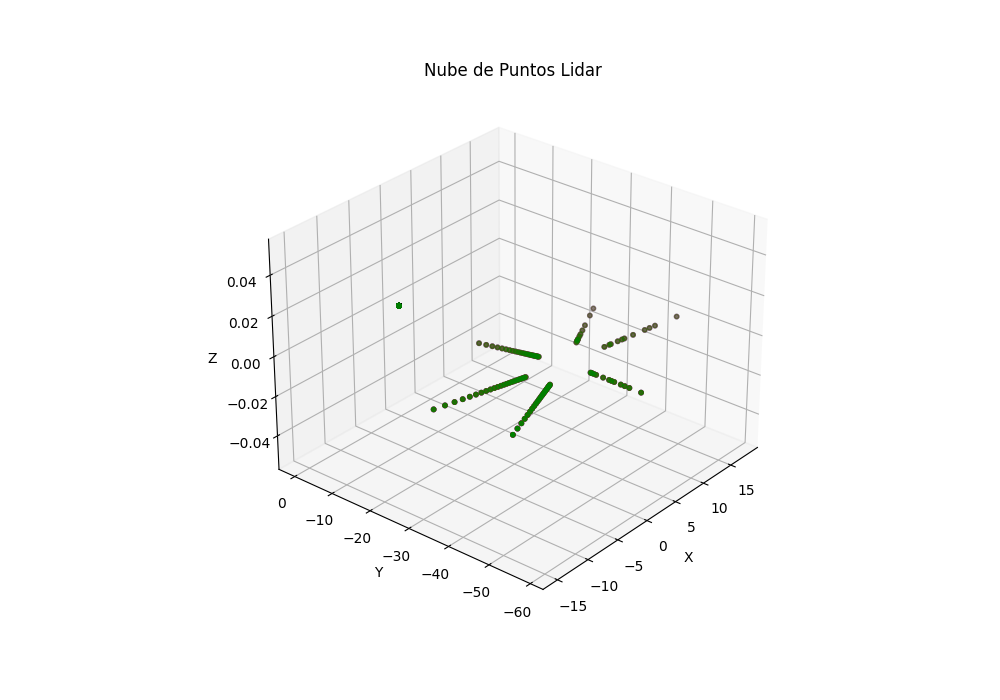
Several tests have been carried out within the same scenario to check the lidar measurements.
Among them, a test has been done with our agent in the same position but with vehicles in different positions and without obstacles. It should be noted that the simulation times are not exactly the same, so there is no doubt that the lidar was not initialised.
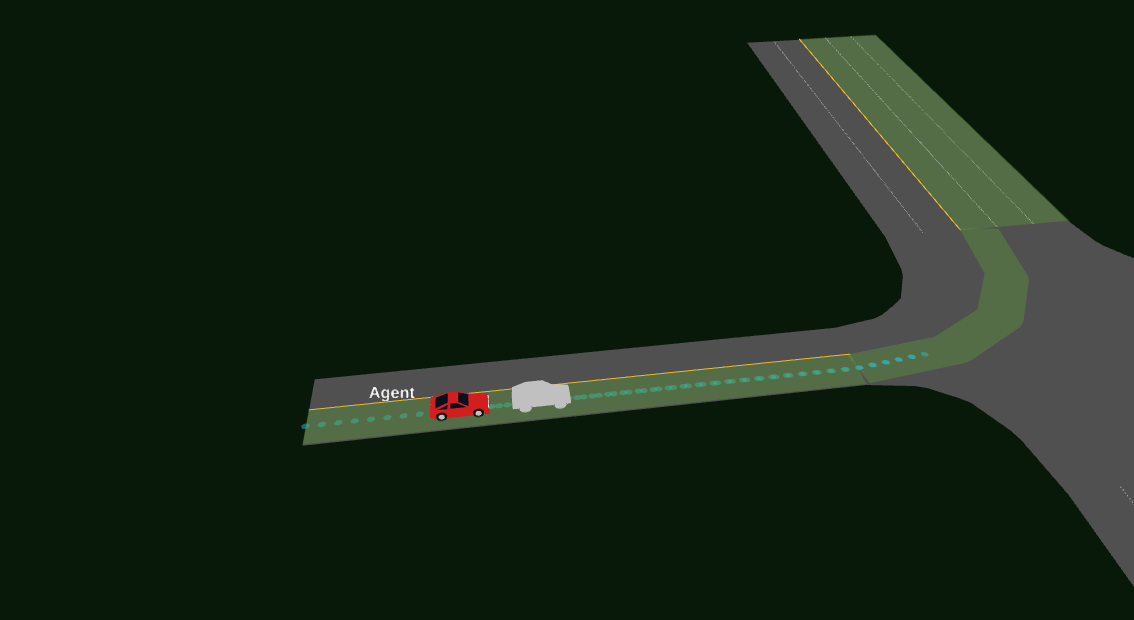
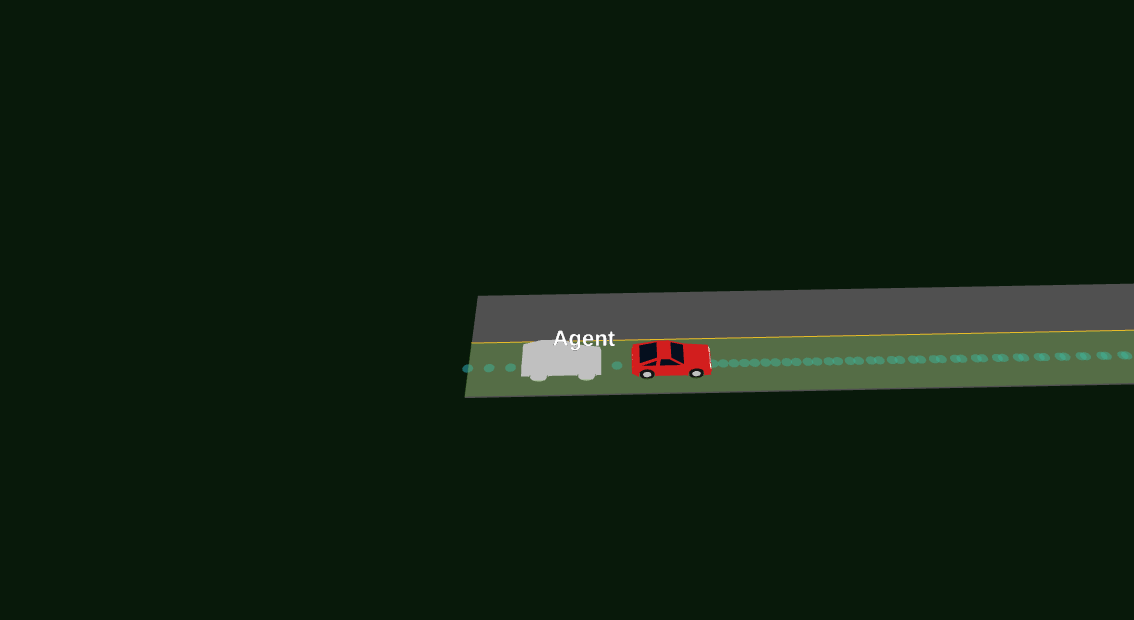
Here is a picture of 3 scenarios, one car in front (blue), one car behind (red), no obstacles (green).
After these tests, it is more than clear that the lidar is not working as it should. Now it will be necessary to determine if the problem is with the SMARTS installation or if it is an issue of theirs…
Setting scenario
By modifying the scenarios, it has been possible to add vehicles (with defined routes) to the desired route location. In addition, it has been possible to modify the speed of each lane, thus creating a simulation of static cars (speed = 0).
1
2
3
4
<edge id="E1" from="junction-intersection" to="junction-north" priority="-1">
        <lane id="E1_0" index="0" speed="13.00" length="32.40" shape="4.80,17.60 4.80,50.00"/>
        <lane id="E1_1" index="1" speed="13.00" length="32.40" shape="1.60,17.60 1.60,50.00"/>
    </edge>
It refers to a two-lane road where the maximum speed for vehicles will be 13m/s, this speed limit does not affect our agent.
1
route = Route(begin=("E5", 1, 18), end=("E5", 0, "max"))
This is the way to create a route, both for a vehicle and for the agent himself.
The first position of the vector refers to the road id, the second is the lane index, and the third is the point in coordinates relative to the lane (bearing in mind that the road is initialised at 0, in transit direction, and ‘max’ symbolises the end of that lane in m).


