Week 18-26.
Hello readers!
During this period I have advanced in the project in the following points:
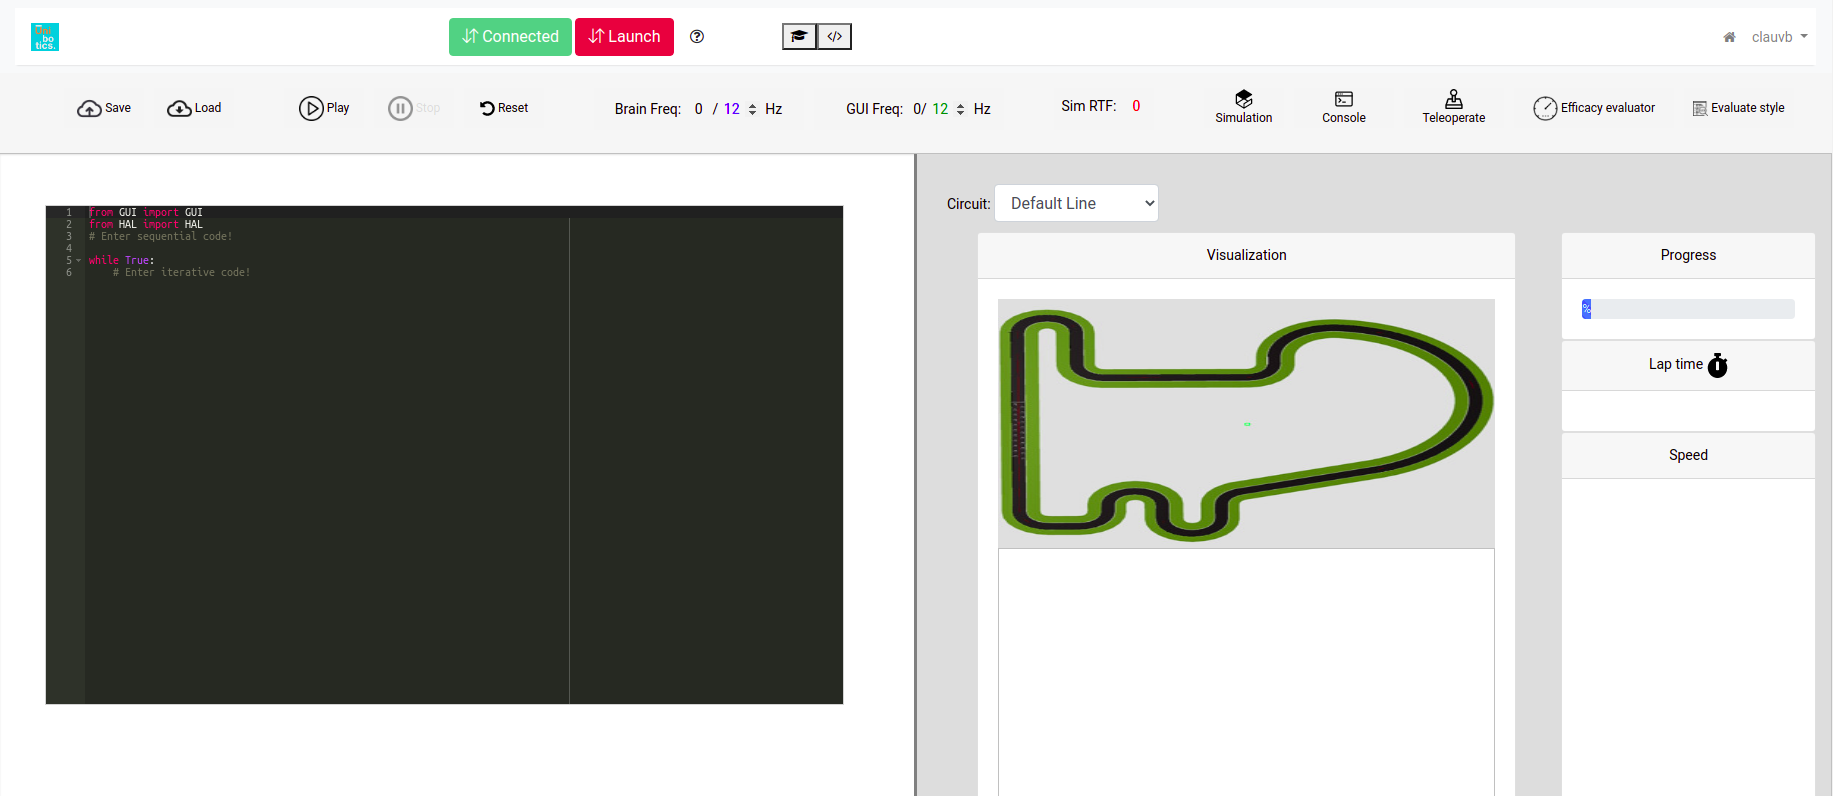
- I have created a new button to be able to evaluate the effectiveness of the exercise performed, when the button is pressed it starts the exercise and after a time it saves the score received in it, if the button is pressed again before that time it stops the exercise and therefore does not save the result. With this button and the style button the two scores are collected in elasticsearch, the two buttons have been placed on the left of the exercises as shown in the image.
-
The style score has been normalized to match the efficacy score (0-100)
-
Elasticsearch dummy has been modified to add these new probes.
-
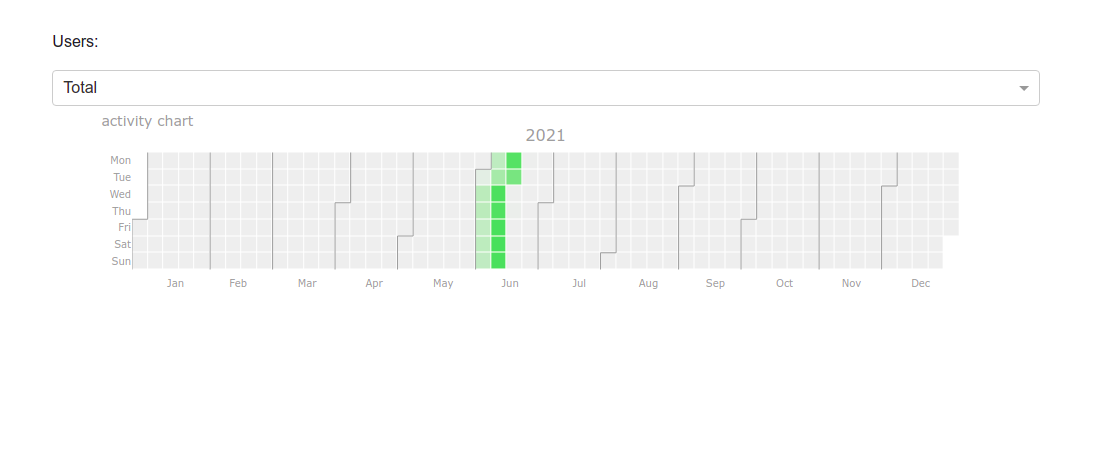
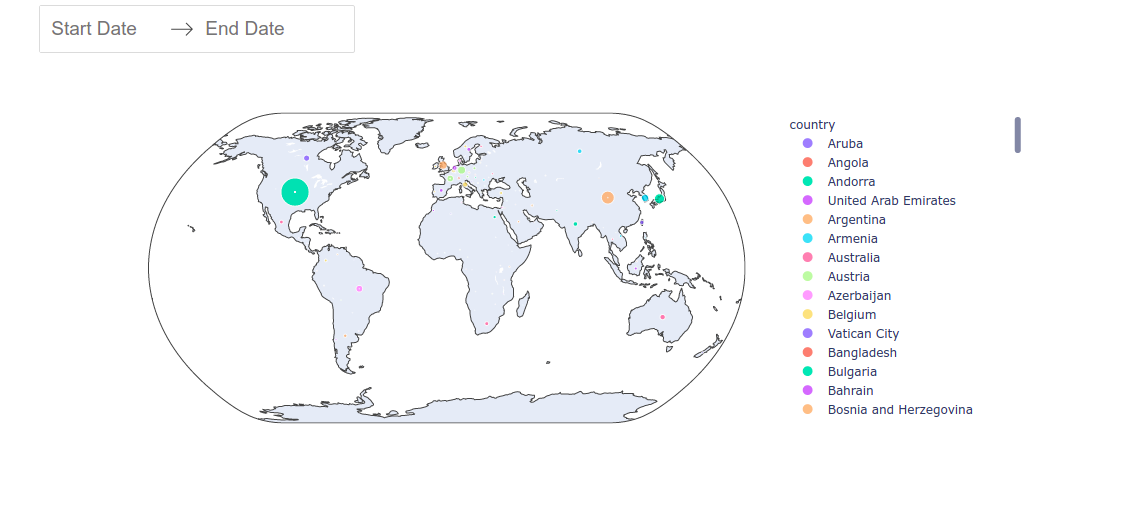
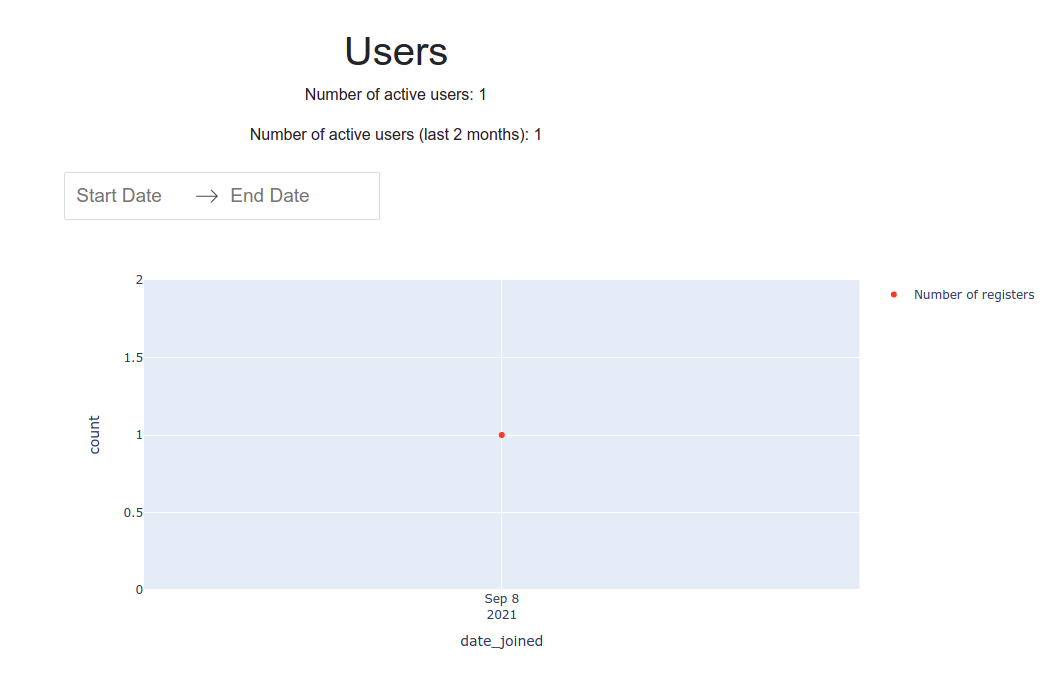
New graphics have been added to Dash: A graph that shows the activity in unibotics with a filter to be able to see the total activity or to be able to see the activity for each user, graph to see where users come from with a filter for dates, and a graph that shows the number of registrations per day, active users and users who have been active during the last two months.
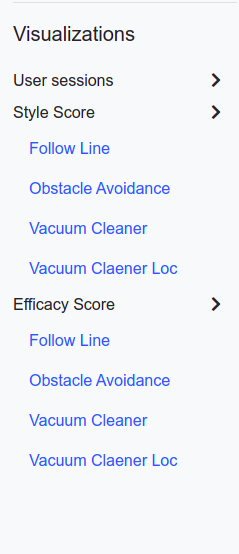
- Finally, in Dash, a login has been set to access, depending on whether you are a staff or a normal user, you will be able to see some graphs or others. In the case that you are a normal user, you will only be able to see the evolution graphs in the style and efficacy scores of each exercise. The menu that a staff would see would be the following: