Week 12-17.
Hello readers!
These weeks I have advanced in the project in the following points:
-I have improved the date filter so that it can be filtered from a date or to a date. Previously it was mandatory to put a start date and end date.
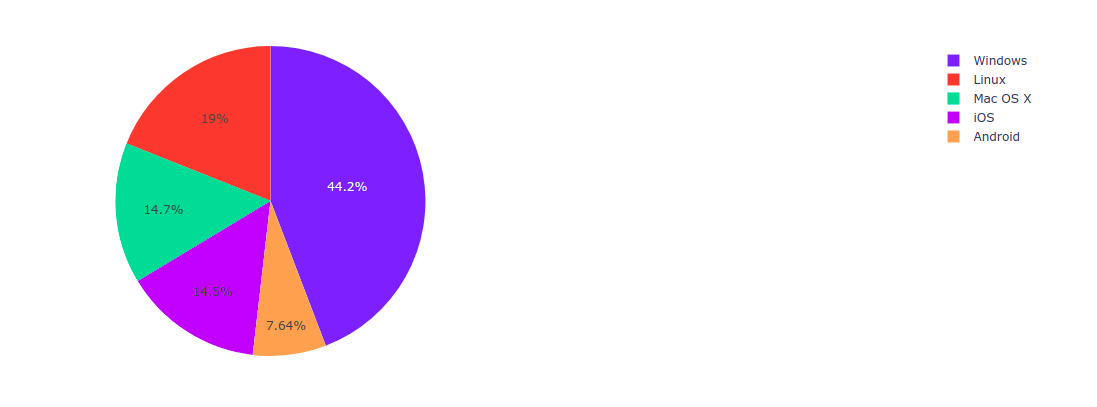
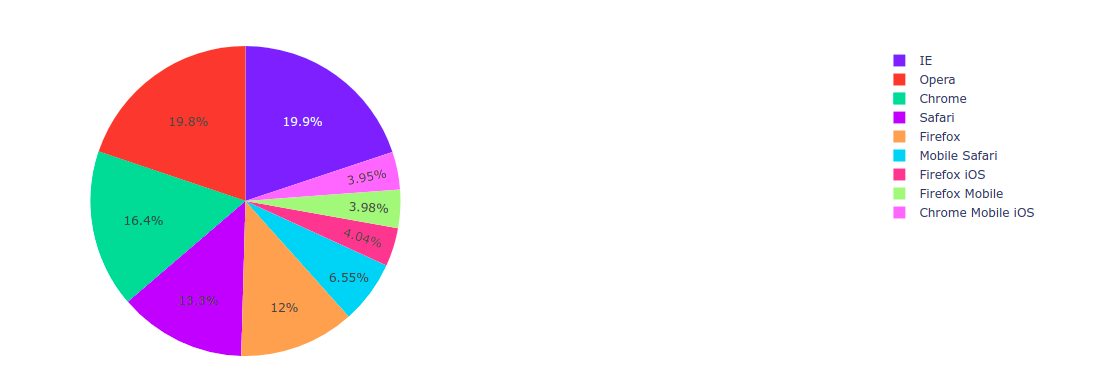
-In dash a pie chart has been added where you can view the OS, another one to be able to see the browser and a bar chart where you can see the total duration of all users, in addition, this chart has the date filter and a filtering, to see the duration per day of a user, this graph also shows a line with the total average in the case of users and an average per day in the case of wanting to see all users. The results are shown below:
-Finally I have saved a new probe with the style evaluation, with its user, exercise, time and score. The same for the probe for evaluating the functionality of the exercises