Week 16 – Dataset Granularity Analysis and Model Comparison
January 13, 2026
Evaluating the impact of dataset granularity on autonomous driving performance using categorized steering and deviation data
This week’s work focused on analyzing how dataset granularity affects model performance. Experiments were conducted using three levels of categorization for steering and vehicle deviation values. Models were trained on MobileNet and PilotNet architectures to compare stability, lane-keeping ability, and overall driving quality.
1. Experimental Setup:
The dataset was balanced and categorized according to the following criteria:
• Steering (W): categorized into 3, 5, and 7 classes.
• Deviation (position/orientation): categorized into 3, 5, and 7 classes.
Models were trained for each combination, resulting in 12 distinct trained models for comparative analysis.
2. Results by Steering Categorization:
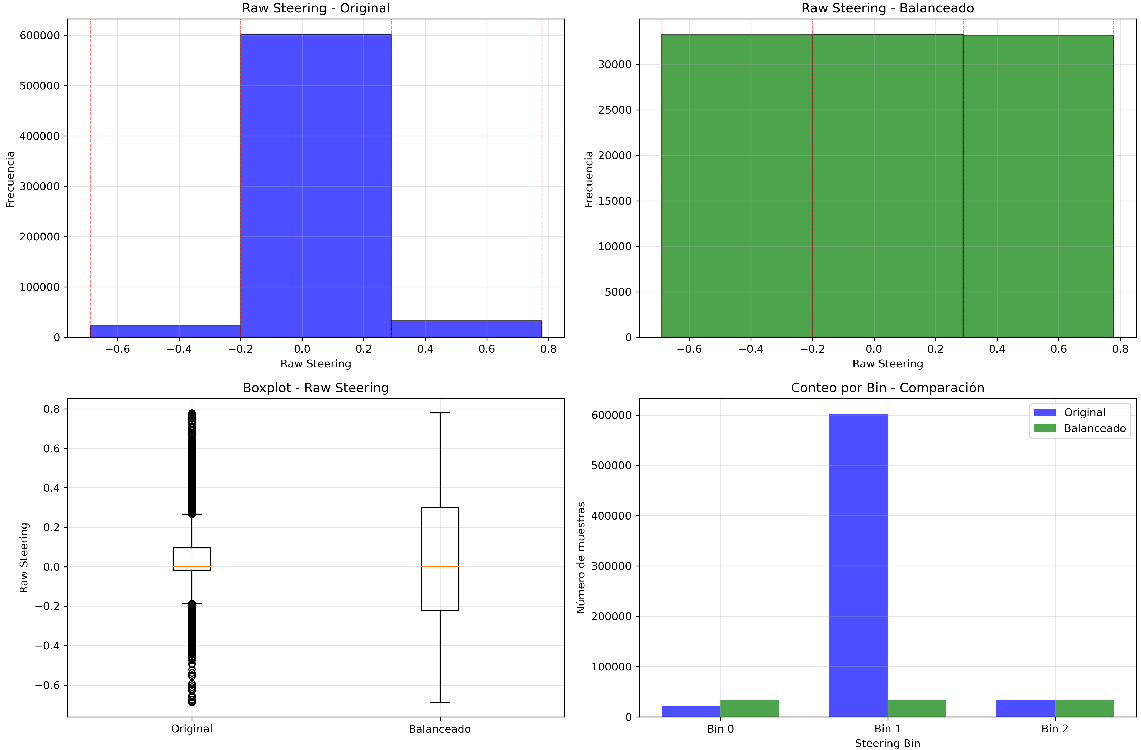
Figure 1: Dataset balanced for 3 steering categories.
MOBILENET – 3 STEERING CATEGORIES
MobileNet demonstration with 3 steering categories.
PILOTNET – 3 STEERING CATEGORIES
PilotNet demonstration with 3 steering categories.
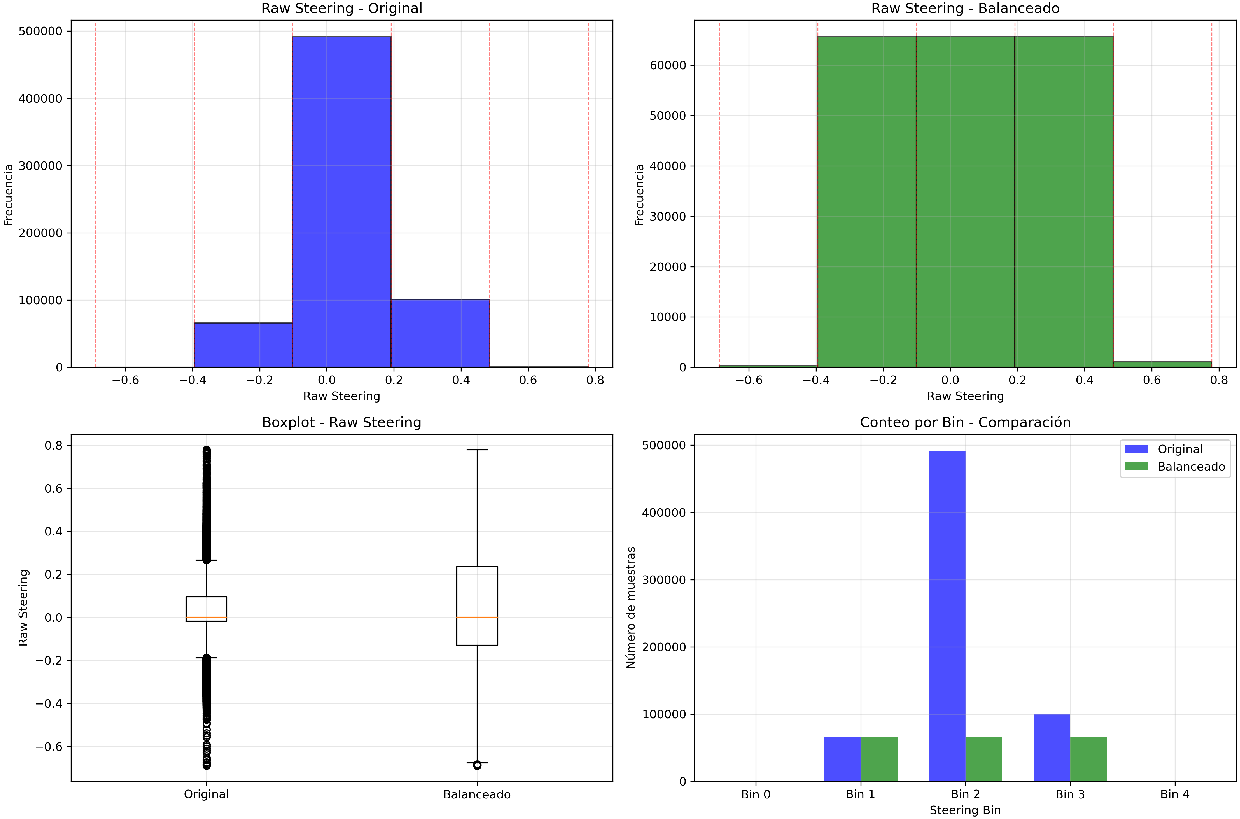
Figure 2: Dataset balanced for 5 steering categories.
MOBILENET – 5 STEERING CATEGORIES
MobileNet demonstration with 5 steering categories.
PILOTNET – 5 STEERING CATEGORIES
PilotNet demonstration with 5 steering categories.
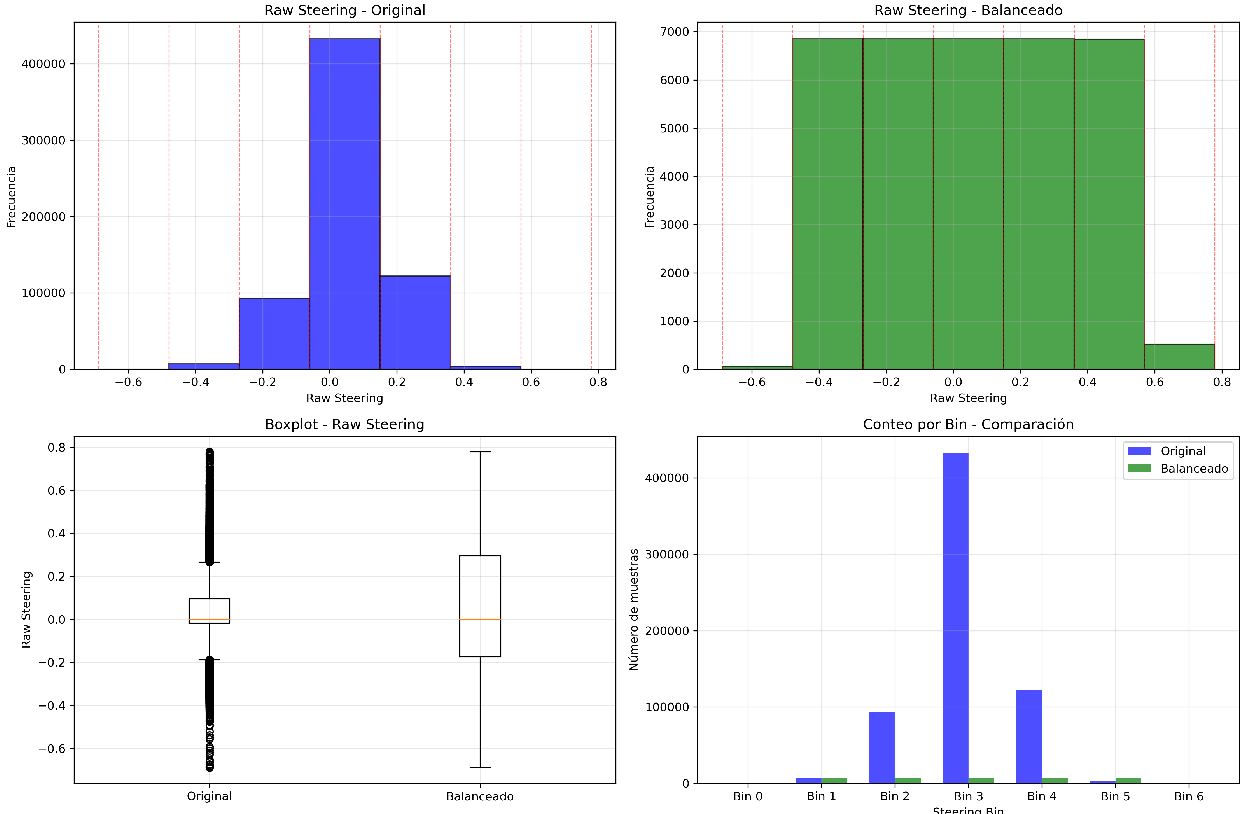
Figure 3: Dataset balanced for 7 steering categories.
MOBILENET – 7 STEERING CATEGORIES
MobileNet demonstration with 7 steering categories.
PILOTNET – 7 STEERING CATEGORIES
PilotNet demonstration with 7 steering categories.
3. Results by Deviation Categorization:
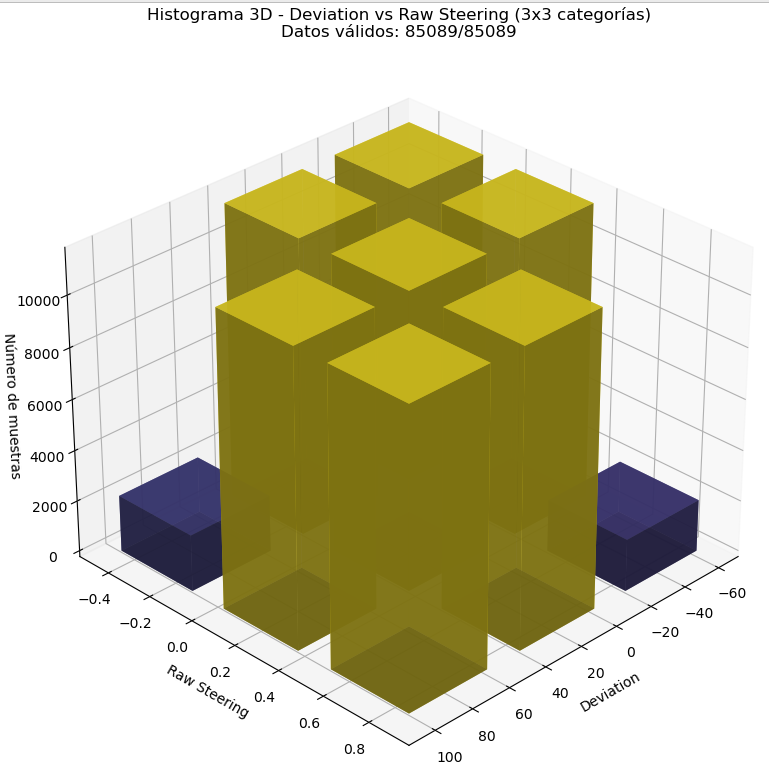
Figure 4: Dataset balanced for 3 deviation categories.
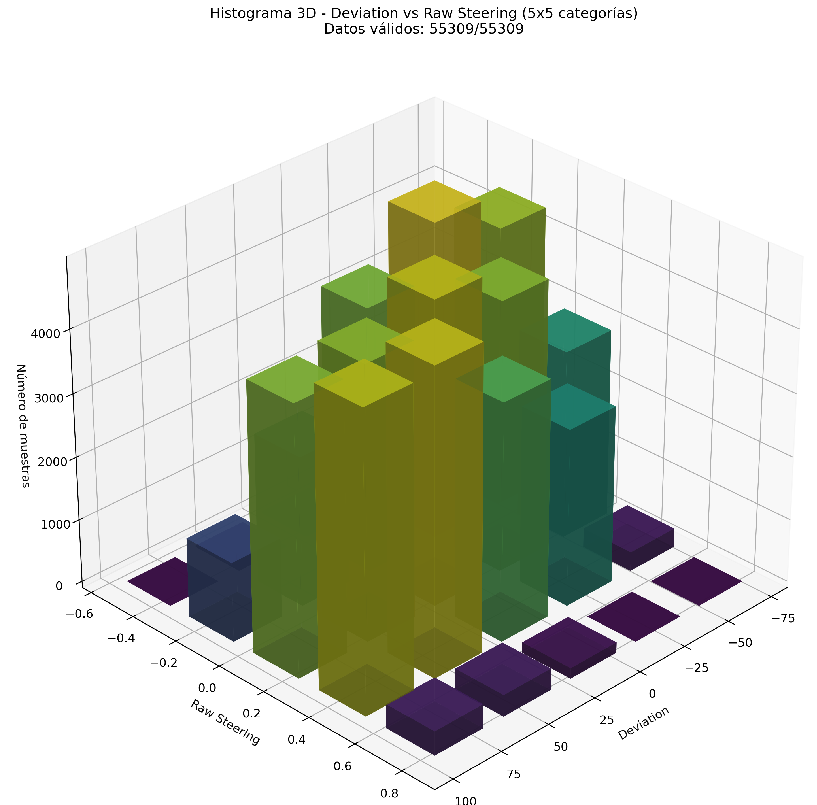
Figure 5: Dataset balanced for 5 deviation categories.
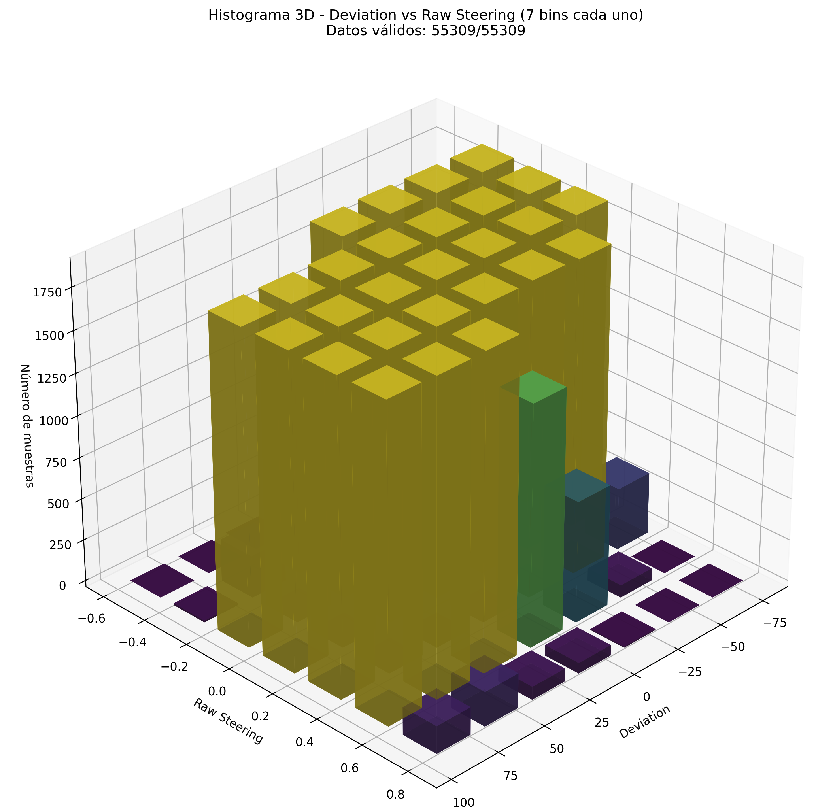
Figure 6: Dataset balanced for 7 deviation categories.
4. Analysis and Conclusions:
KEY FINDINGS:
• MobileNet consistently demonstrated better path tracking and higher stability, maintaining smooth lane changes compared to PilotNet.
• PilotNet showed less stability and inadequate lane-return behavior, especially when trained only on steering data.
• Including deviation data (position/orientation) improved PilotNet’s ability to stay on the road longer, though driving remained less stable with more time spent outside the right lane.
• Increased granularity (more categories) improved model responsiveness but also raised the probability of lane departures and collisions when only steering was used.
• Combining steering and deviation data with higher granularity (5×5 or 7×7 categories) yielded the most balanced performance, as shown in Figures 5–7.
5. Next Steps:
Future work will focus on quantifying the observed behaviors with the proposed metrics and further refining dataset balancing strategies. Hybrid approaches combining the stability of MobileNet with the responsiveness of PilotNet will also be explored, along with continued dataset expansion using DAgger methodology to capture edge cases and failure scenarios.
Conclusion:
Week 16 provided valuable insights into the role of dataset granularity in autonomous driving models. MobileNet proved more reliable for stable lane-keeping, while PilotNet benefited significantly from the inclusion of deviation data. Higher granularity generally improved model nuance but required careful balancing to avoid overfitting to steering extremes. These findings will guide the next phase of model optimization and dataset enrichment.