Week 41 · August 29, 2026
Lane Recovery Integration via Sigmoid Steering
August 29, 2026
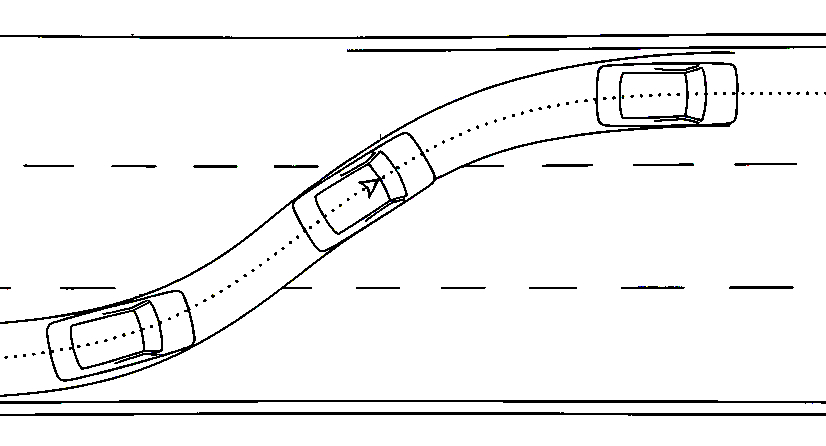
This week's work focused on integrating "lane recovery" maneuvers into the training datasets. The recovery driving was implemented as a smooth sigmoid curve with steering values limited to approximately ±0.08 (roughly 30 degrees of steering wheel angle). Two distinct methodologies were explored to incorporate these new recovery examples into the training pipeline.
📌 Approach
The base datasets (already classified by maneuver type) were augmented with a new "lane recovery" category. The recovery examples were generated using a smooth sigmoid steering profile with a maximum steering value of approximately 0.08.
These new recovery samples were then incorporated into the training dataset compositions alongside existing maneuver categories.
Table 1 below presents the proposed compositions with varying numbers of recovery lane samples:
| Composition |
Comp 0 |
Comp 1 |
Comp 2 |
Comp 3 |
Comp 4 |
Comp 5 |
| Turn Left (%) |
10.00% |
9.30% |
9.00% |
8.60% |
8.30% |
— |
| Turn Right (%) |
20.00% |
18.60% |
18.20% |
17.20% |
16.70% |
— |
| Recovery Lane (Proposed) (%) |
0.00% |
7.00% |
9.00% |
13.90% |
16.70% |
— |
| Hard Drunk Dagger (%) |
7.50% |
7.00% |
6.80% |
6.50% |
6.20% |
— |
| Medium Drunk Dagger (%) |
7.50% |
7.00% |
6.80% |
6.50% |
6.20% |
— |
| Soft Drunk Dagger (%) |
10.00% |
9.00% |
9.00% |
8.60% |
8.30% |
— |
| Straight (%) |
45.00% |
42.00% |
41.00% |
39.00% |
38.00% |
— |
| Recovery Lane Samples |
0 |
4,665.5 |
6,138 |
10,008 |
12,424.8 |
— |
| New Total Samples |
62,000 |
66,650 |
68,200 |
72,000 |
74,400 |
— |
Table 1: Proposed compositions when adding new "recovery lane" maneuver samples.
New datasets were generated following the compositions in Table 1. For each composition, 5 different random seeds were used, and the best-performing seed (based on training results) was selected.
📌 Approach
After generating the lane recovery examples, the best-performing dataset from Week 40 was taken as the base. Specifically, Composition 7 with seed 123 was used, which demonstrated the best results in the previous week.
The goal was to augment this already successful dataset with additional examples that would enable the trained models to imitate the lane recovery maneuver.
This methodology allowed us to directly enhance a proven model with recovery capabilities while maintaining the other desirable properties already achieved.
📊 Benchmark Model
The model trained on Week 40 – Composition 7 with seed 123 was used as the benchmark. This model was characterized by:
- ✅ Stable driving without oscillations
- ✅ Proper left and right turns
- ✅ No road departures in the tested scenarios
- ❌ No lane recovery capability
📌 New Metric: Right-Lane Driving Percentage
With functional models now available, a new metric was defined: percentage of driving in the right lane. This metric measures the proportion of frames where the vehicle maintains the correct lane position relative to total frames. Other metrics (e.g., lane departures, time between departures) are still under development.
Table 2 below presents the best-performing runs for both correct initial position/orientation and random initial conditions:
Table 2: Results for correct initial position/orientation.
| Dataset/Model |
Driving Time |
Collisions |
Avg. Correct Lane Driving (%) |
| Week 40 – Comp 7 (Seed 123) |
5:01 |
0 |
42% |
Table 3: Results for random initial position/orientation.
Note: No notable difference in driving performance was observed between the two dataset construction methodologies.
-
✅ Lane Recovery Capability Achieved
Taking the 3 best-performing models, it is evident that models successfully acquired lane recovery capability. In particular, the model trained with Composition 7 and seed 123 demonstrated correct driving with minimal departures (only in the left-curve plaza where models consistently struggle). This validates the approach of adding recovery examples using a smooth sigmoid curve to teach the recovery maneuver.
-
⚠️ Trade-off: Collisions vs. Robustness
While the best recovery-capable models all experienced collisions (unlike the benchmark model without recovery examples), the percentage of correct lane driving and robustness to changing initial position/orientation were significantly superior in the recovery-trained models.
⚠️ Remaining Challenge
Although recovery capability was achieved, the models still exhibit confusion in plaza areas and complex intersection scenarios. Future work should address these edge cases.
🔜 Next Steps
For the upcoming week, we plan to generate new datasets with different compositions to further improve autonomous driving performance. The focus will be on:
- Exploring additional composition variations
- Addressing remaining confusion in plaza and intersection scenarios
- Refining the recovery maneuver examples
📌 WEEK 41 SUMMARY – AUGUST 29, 2026
🎯 Objective: Integrate lane recovery maneuvers into training datasets using smooth sigmoid steering (max ±0.08).
🧪 Methodologies: (1) Add recovery lane as a new category in dataset compositions; (2) Augment the best Week 40 model (Composition 7, seed 123) with recovery examples.
📈 Top Results: Week 41 – Composition 4 (seed 123) achieved 88% correct lane driving (vs. 48% for the benchmark), with a driving time of 2:16.
✅ Achievements: Lane recovery capability successfully demonstrated; models show increased robustness and significantly higher correct lane driving percentages.
❌ Limitations: Recovery-capable models experienced collisions; confusion persists in plaza and complex intersection areas.
🔜 Next Steps: Generate new datasets with varied compositions to improve performance and address remaining collision and confusion issues.