Starting with the logs
1. Logs and Plots
Hello there,
This week I’ve been working on the logs tools for the administrator user of the Kibotics website.
First of all i wrote a simple python script to artificially generate a log file to work with, the file has this format:
DATE OF CONNECTION - USER
DATE OF CONNECTION - USER
DATE OF CONNECTION - USER
DATE OF CONNECTION - USER
DATE OF CONNECTION - USER
DATE OF CONNECTION - USER
DATE OF CONNECTION - USER
...
It’s just a temporal format to start working with the plotting tools.
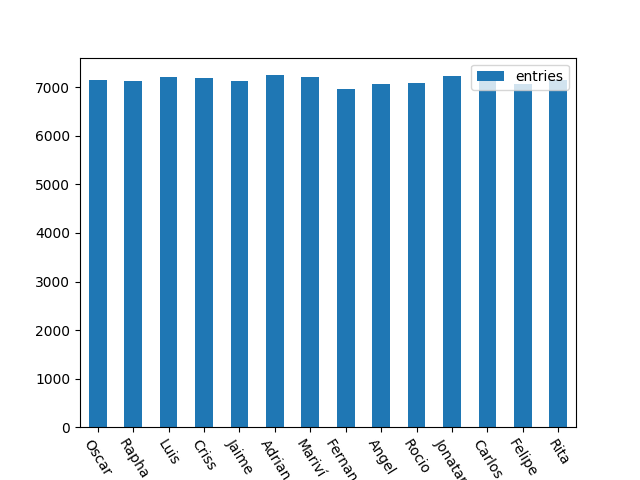
With another python script I’ve started playing with the different graph formats that we are going to use in this project and how to manage the data contained in the log files, I’ll leave down here a example image of the log file represented in a bars graph.
There are just some first steps to get used to the libraries, on the next week I’ll integrate this tools in a demo web-page.