Week 11.
Hello readers!
This week I have done the following tasks:
-I have modified the elasticsearch dummy file so that the data of the start and end dates are concentrated in two weeks (the two weeks before the day you execute the code) also one week will have 25% of the data and the following week the The remaining 75%, this causes a graph like the following:
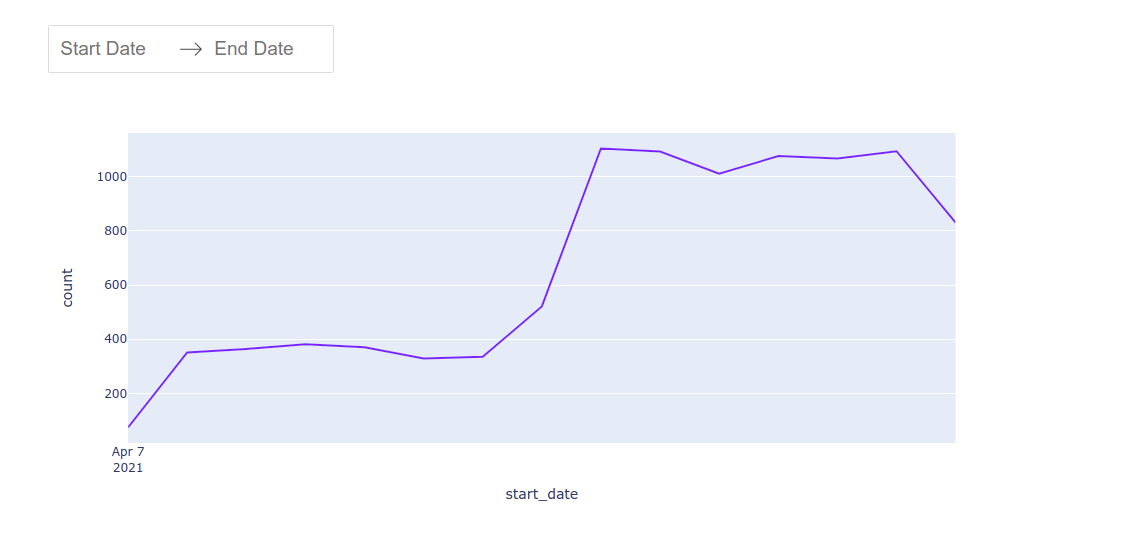
-With Dash we have managed to visualize the elasticsearch dummy data, we have also added a date filter so that only the chosen date range is shown