(1-2 Months) Next weeks. Friss model module.
The following weeks, I was working on developing an app to model a radio frequency signal.
To do it, I used the Friss propagation model, which gives us the received power of a signal in Watts.
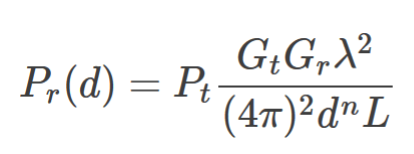
This formula also allows us to model different spaces by changing the “n” exponent.
First approach
So the first thing I tried is to simply implementing the formula numerically, and test it to see how it works.
P_t = 10 # Trasmitter power (Watts)
G_t = 1 # Gain of transmitter (Watts)
G_r = 1 # Gain of receiver (Watts)
lmd = 1 # Wavelength (250/260 MHz)
L = 1 # Other losses factors L = 1 --> no losses
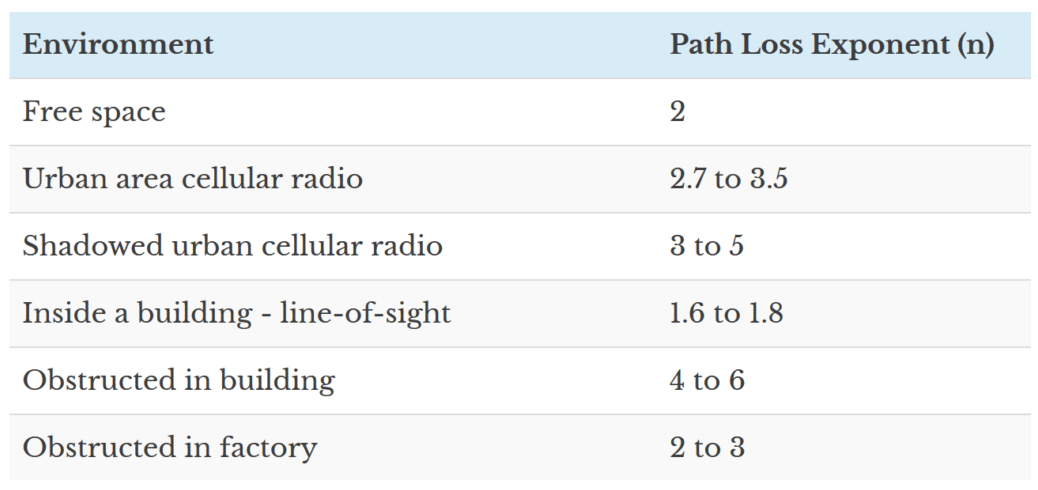
n = 2 # Path Loss Exponent (for different environments)
d = 1 # Distance (m)
P_r = P_t * (G_t * G_r * (lmd)**2)/(((4 * np.pi)**2) * (d**n) * L)
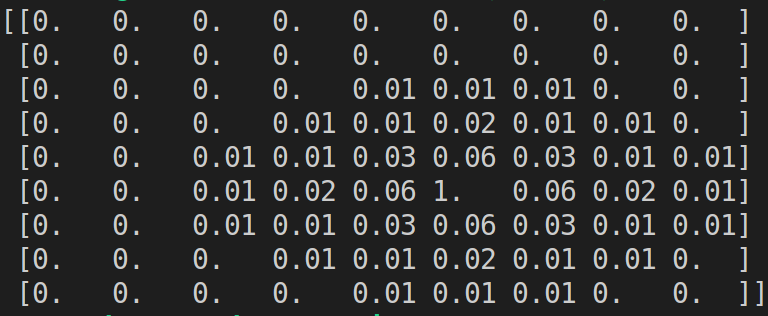
But wasn’t enough to see it’s effect, so I used a numpy matrix simulating different distances between cells. And here is what I got:
Making the module
I decided to make a separated module (without using ROS), to create an app that permits, whoever, to modify and see changes dinamically by using the Friss model.
So I created a Friss class that haves this API:
class Friss:
    '''
    reset_world         --> Resets current world.
    get_world_sz        --> Returns world size.
    set_values          --> Set friss formula parameters.
    model_power_signal  --> Fills power data.
    model_signal_losses --> Fills losses data.
    print_all           --> Prints all parameters.
    test                --> Model some cases.
    '''
This class let us to generate the RF signal data and modify every parameter in the equation. Also provides an extension to make a path loss model and some debugging options to see what is happening.
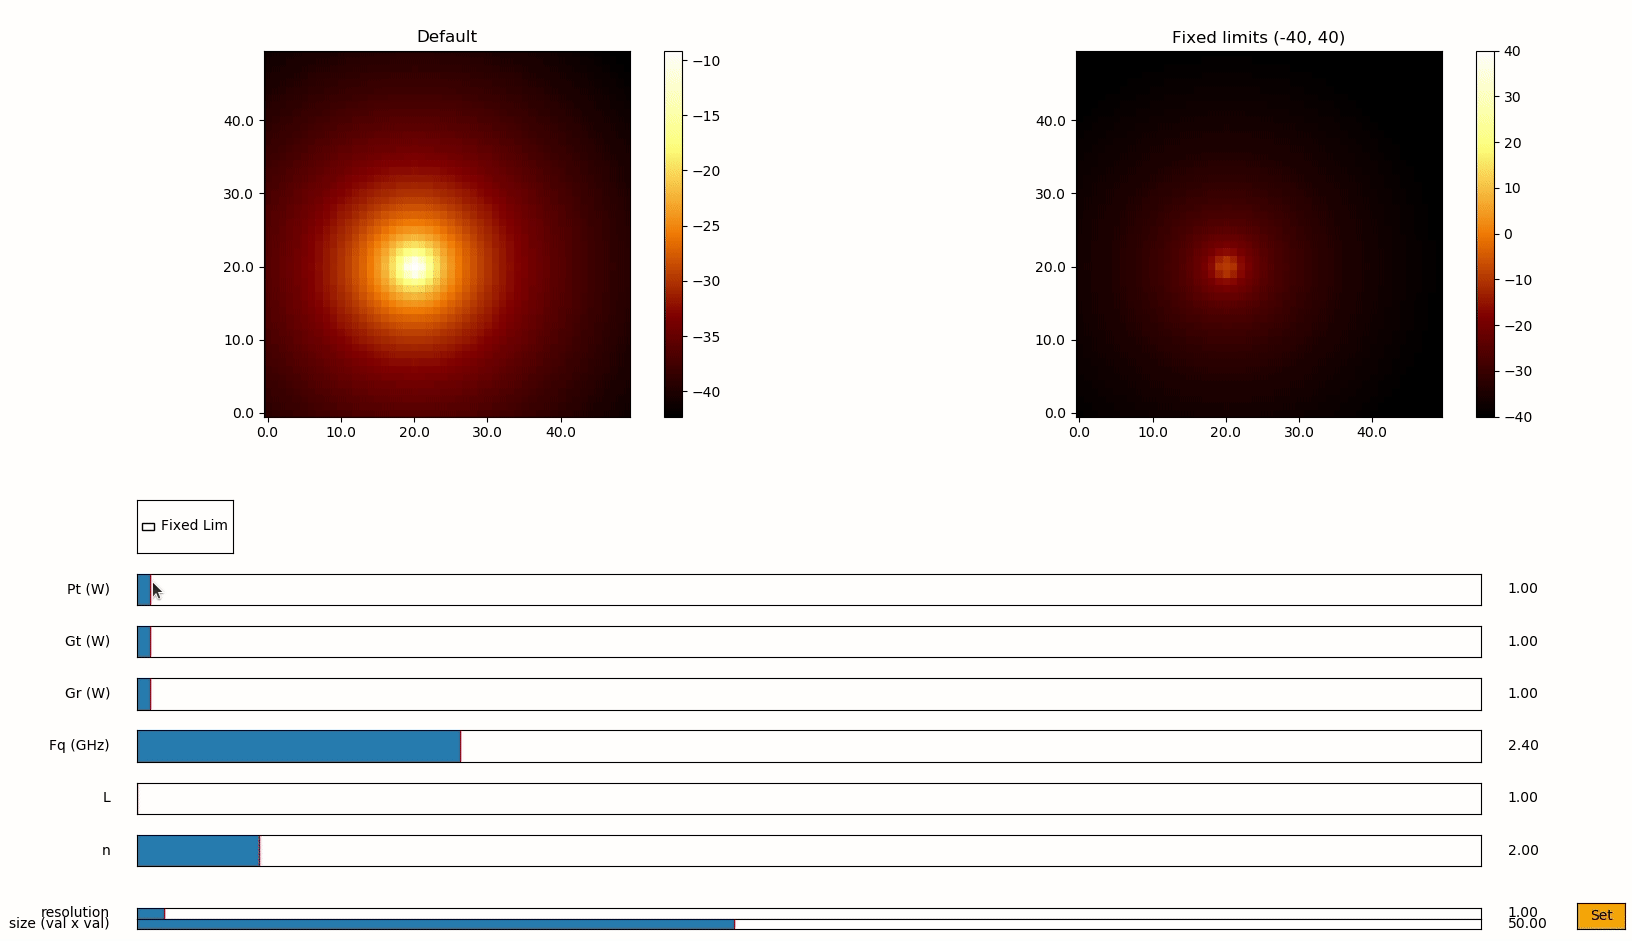
GUI
The next goal was to be able to see the changes dynamically, in order to be able to model faster later on. In this case, I decided to develop a graphic interface with a representation of the results, after changing any relevant parameter.
To make that possible, I used matplotlib. The idea was to make some reactive sliders and buttons, and display the result using a colormap. Here we can see the evolution:
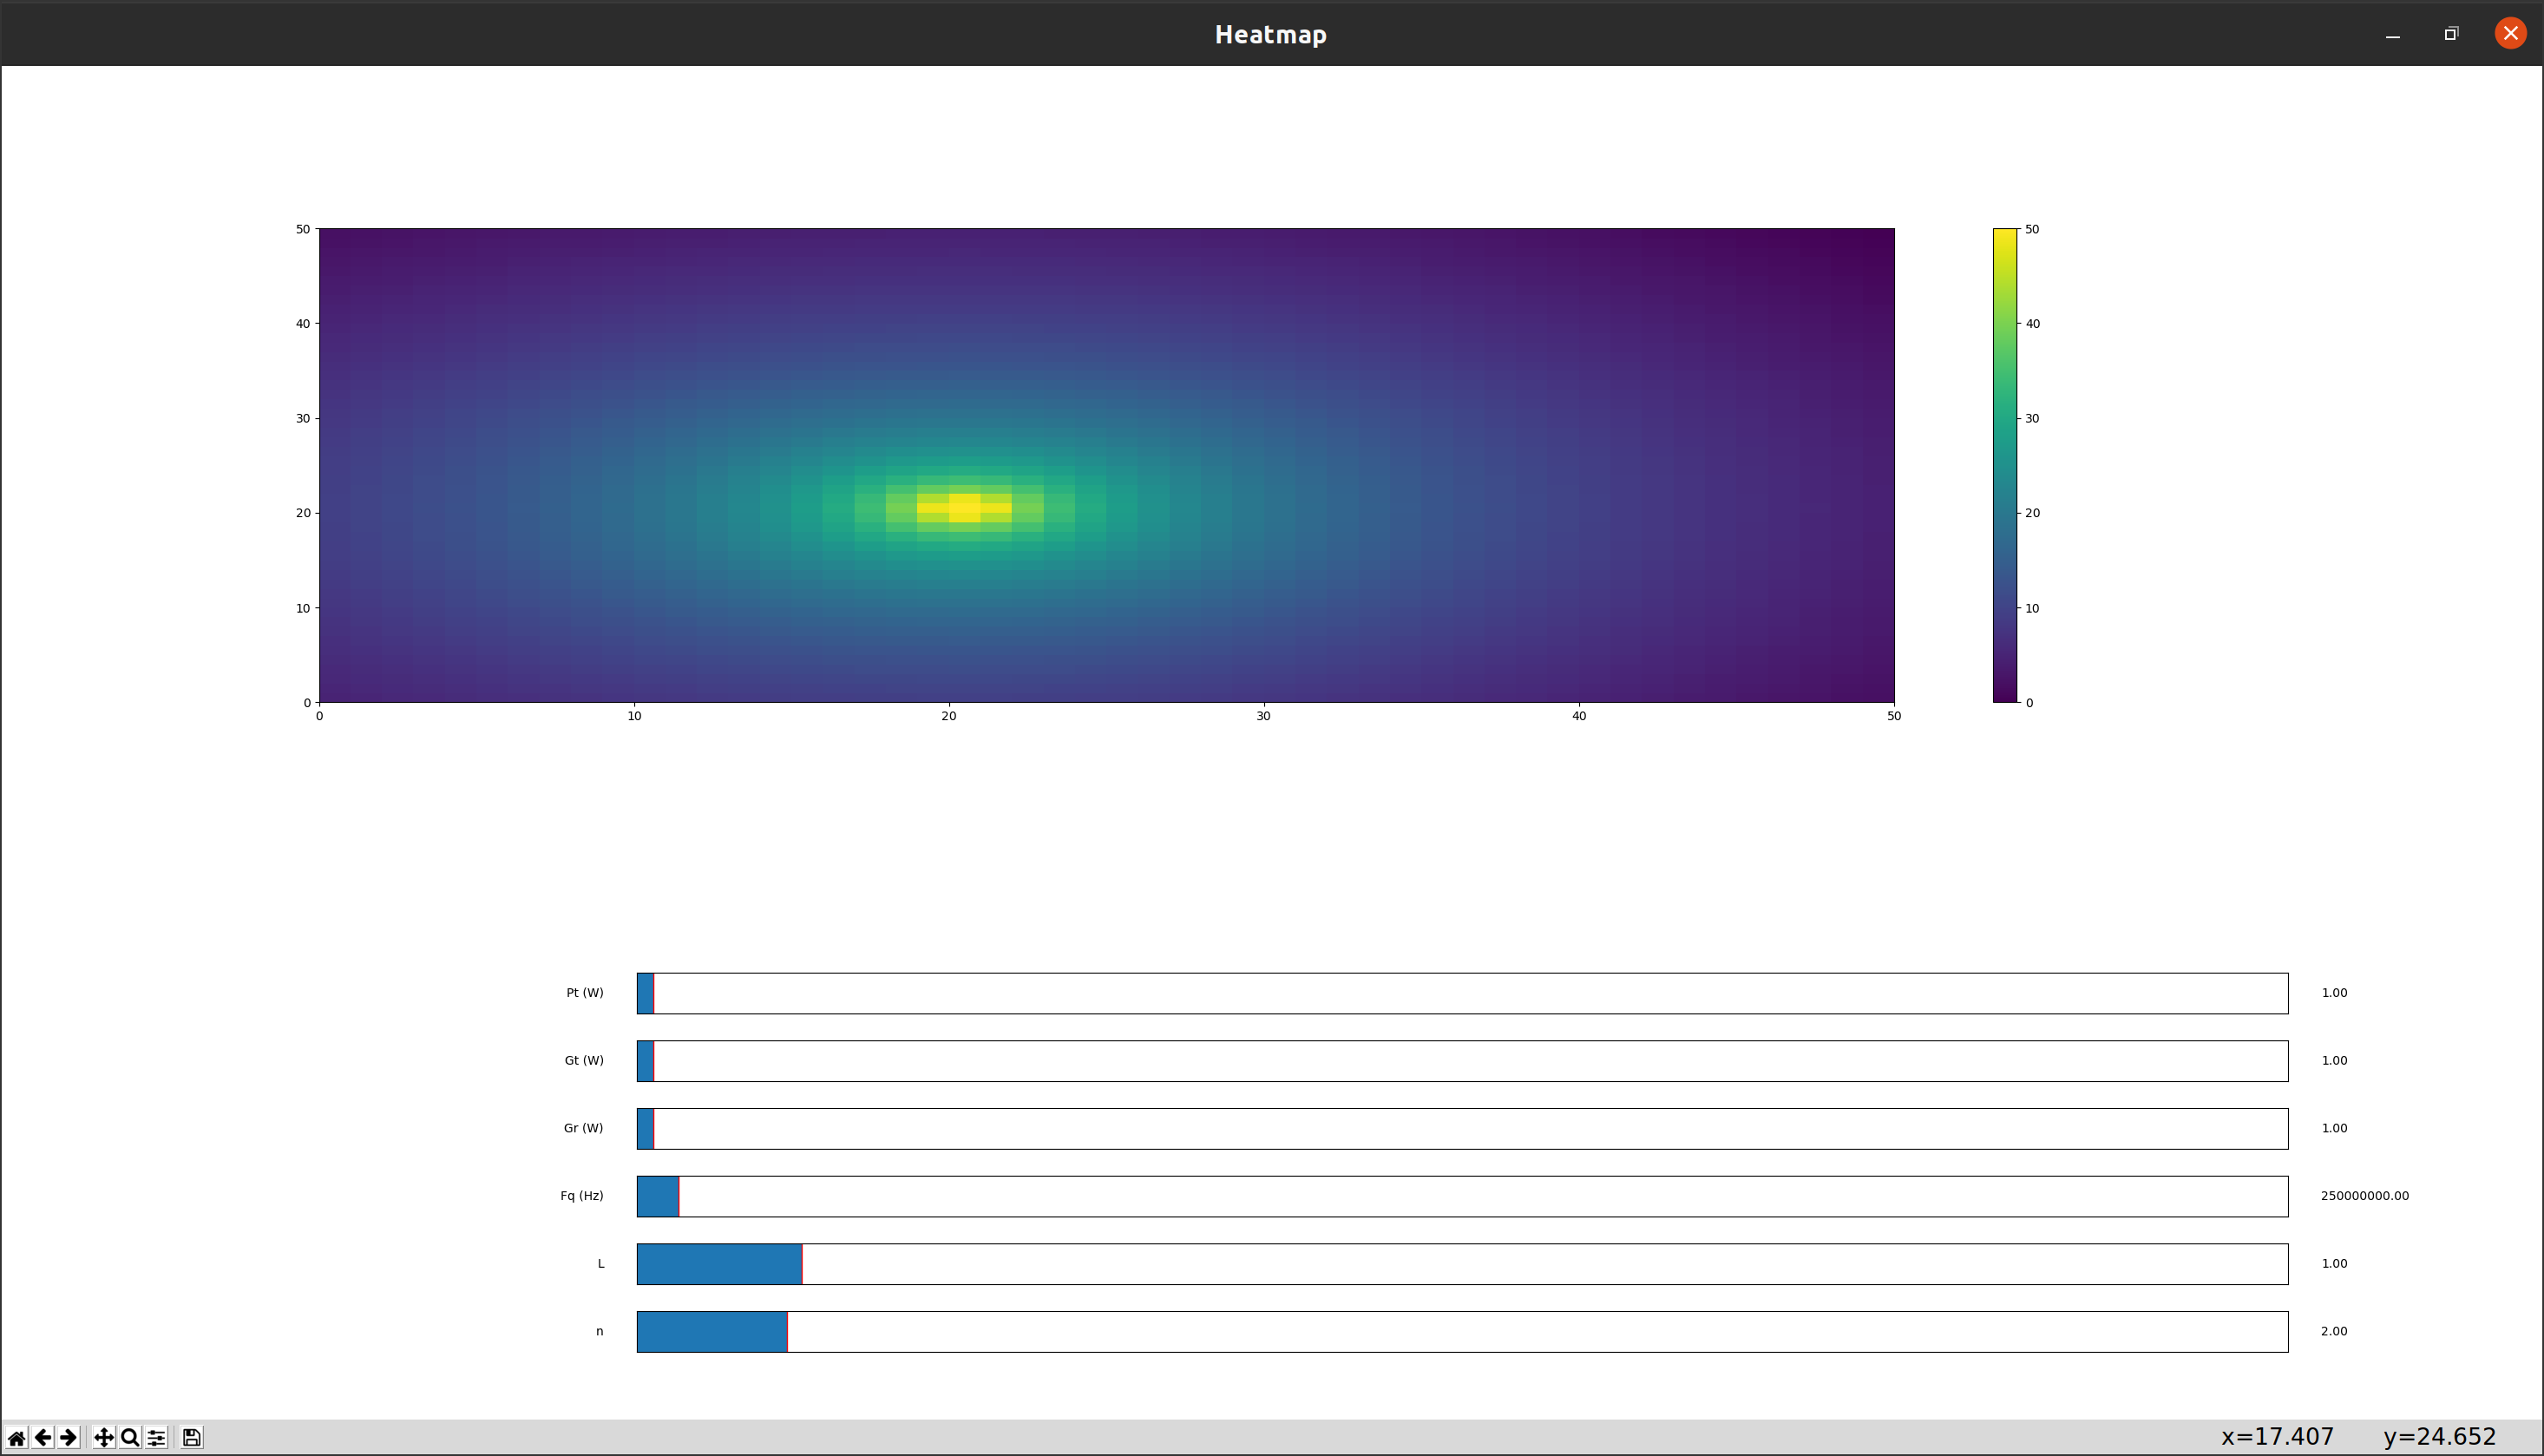
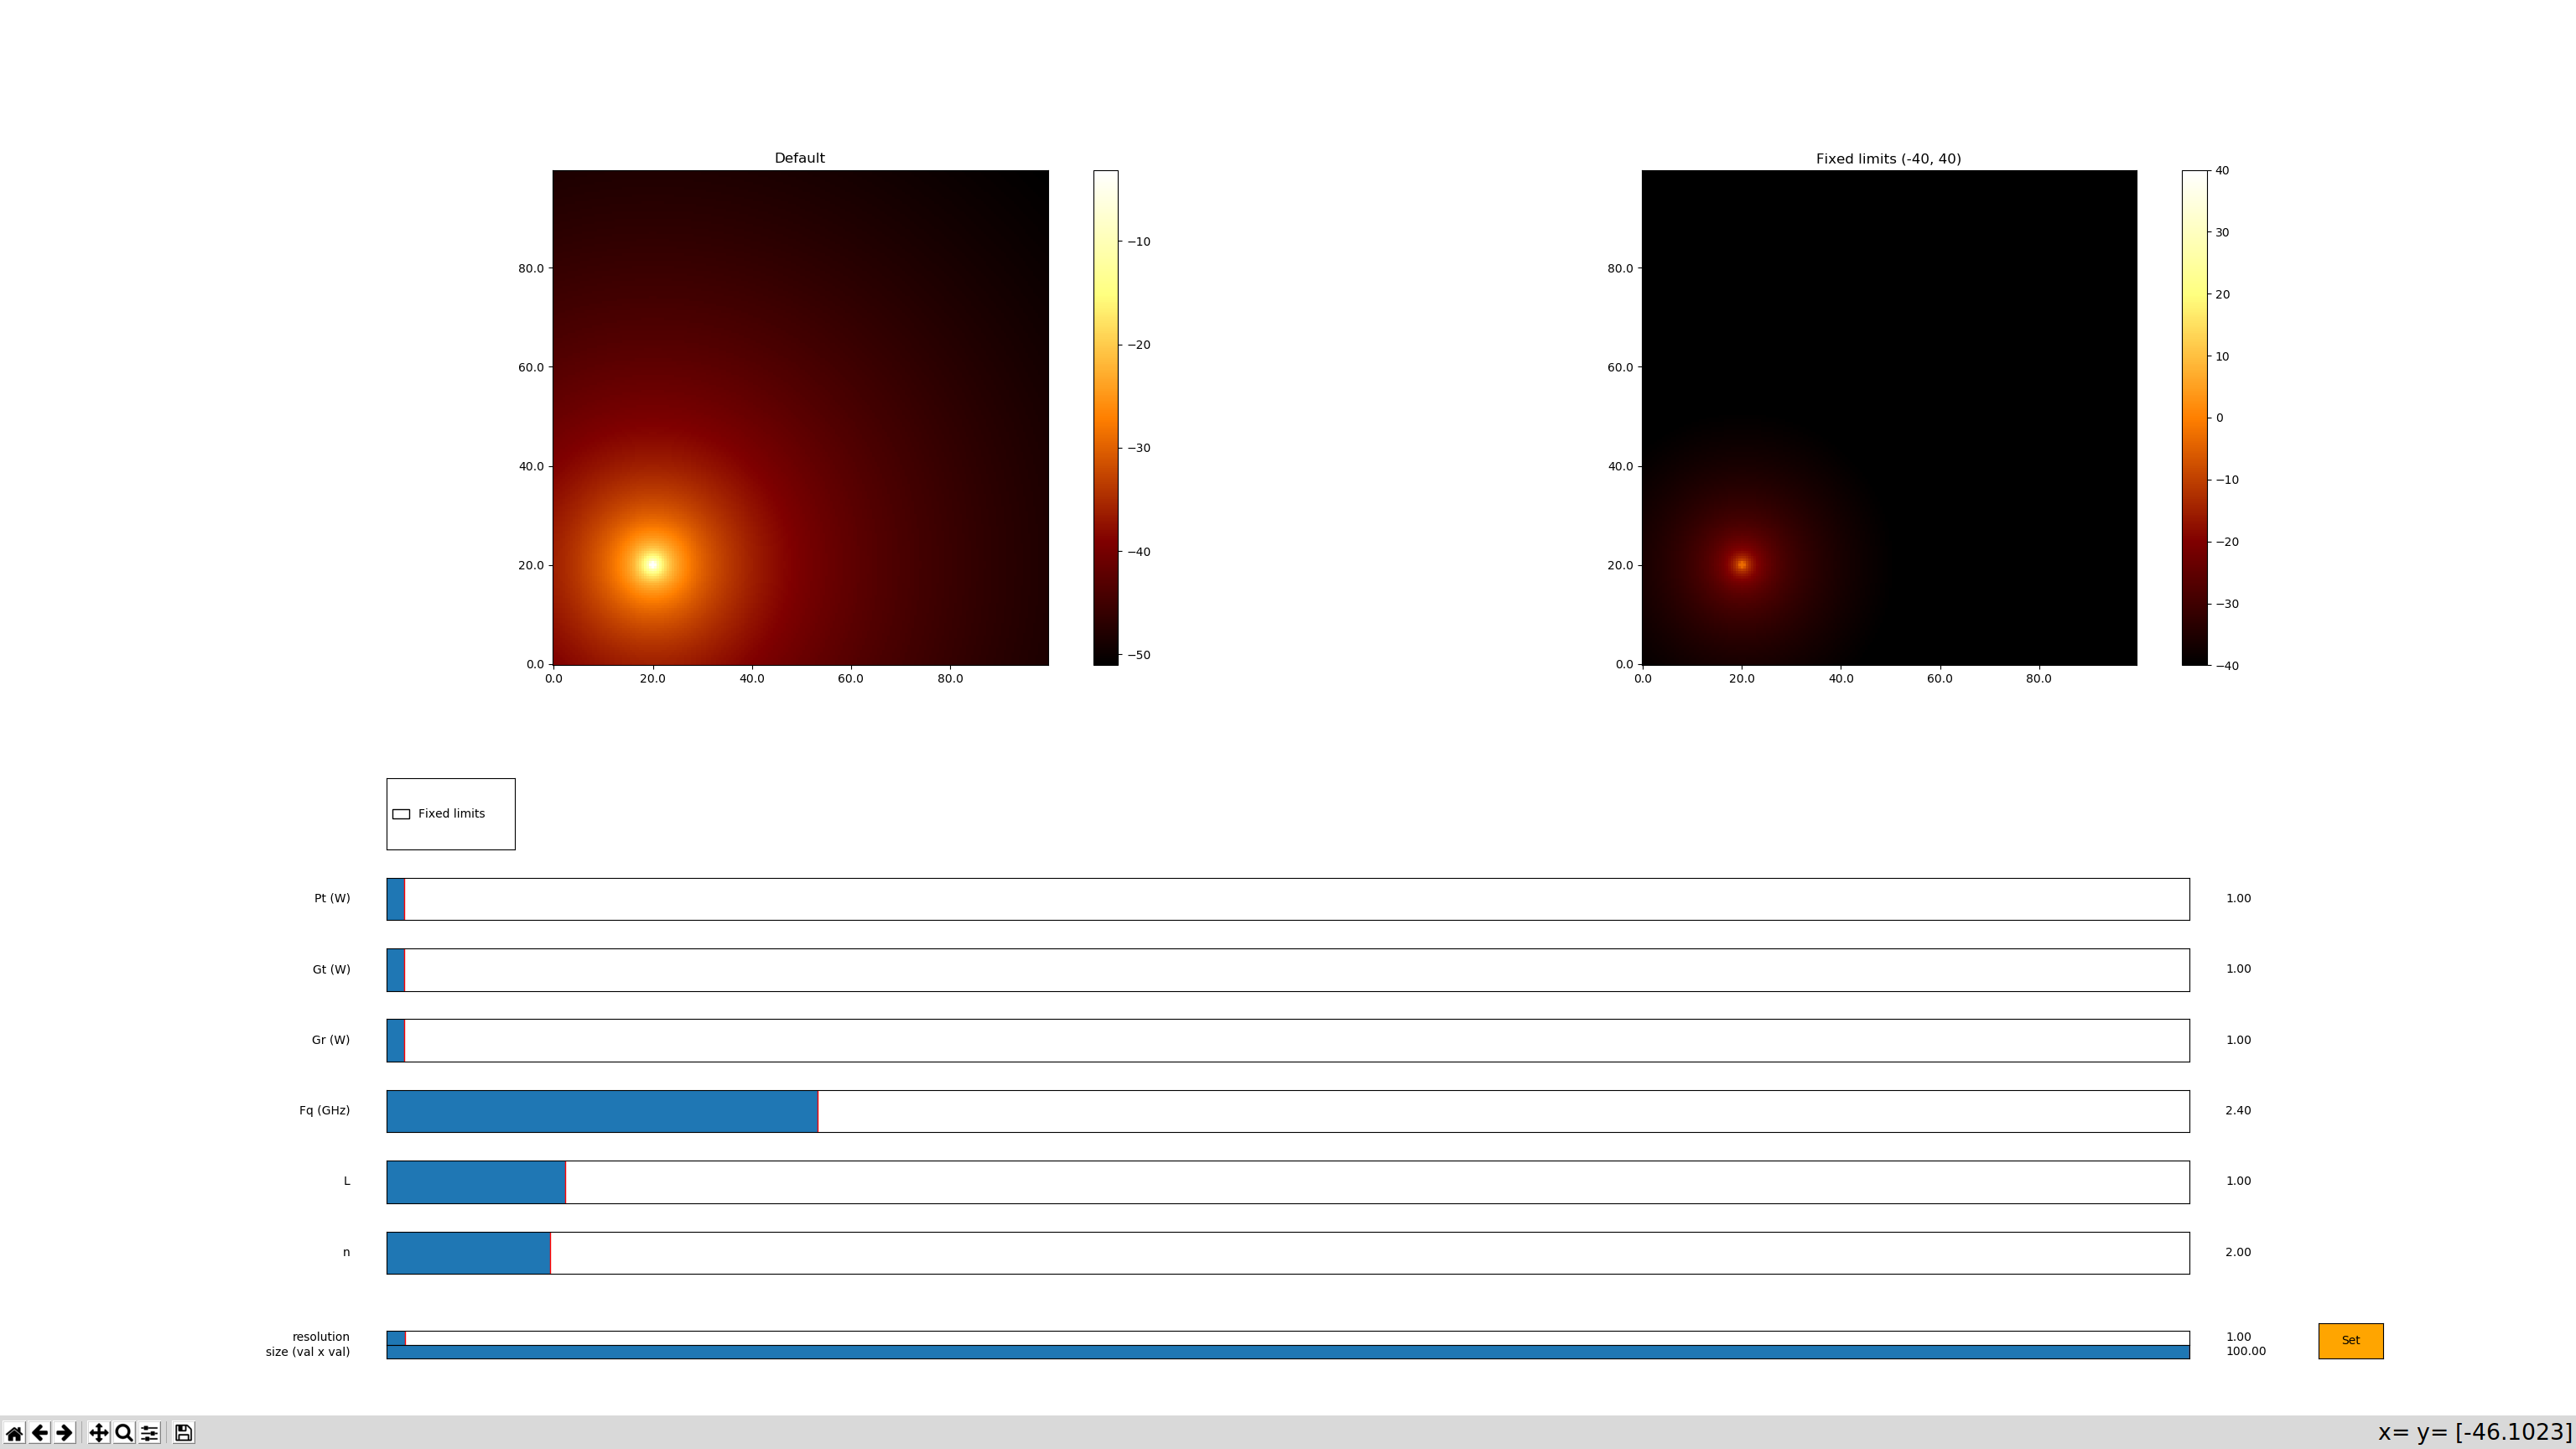
It is worth to mention that, for coding reasons, I decided to use two displays:
- Default, which changes the values range.
- Fixed, which let us see how the values changes by fixing upper and lower limits.
And after adjusting everything, here is an example of a signal in an empty space: