
Week 20 - Model analysis so far
For this week, we are going to mainly focus on analyzing the behaviour of the model, and try to understand better the different things that made it work better than the other weeks. With this, we make a list of things that need to be check this week:
- Create a new dataset that only covers the right lane of the road
- Understand our PilotNet-like model
- Show and analyze the throttle of the car to see if it is learning something
Create a new dataset
This task was made mainly to solve the most basic problem at hand, make the car run in its corresponding lane. To do this, the principal idea was to change the whole dataset, and this was because the way we gathered data, was to make the car run a certain amount of time through different starting waypoints. This starting waypoints were selected at random, so if a road had multiple roads, it wouldn’t distinguish wether if he should be on one lane or other. So, by selecting precisely the starting waypoints that correspond to the left lane of each town, we hoped to solve the problem of the car going through the wrong lane.
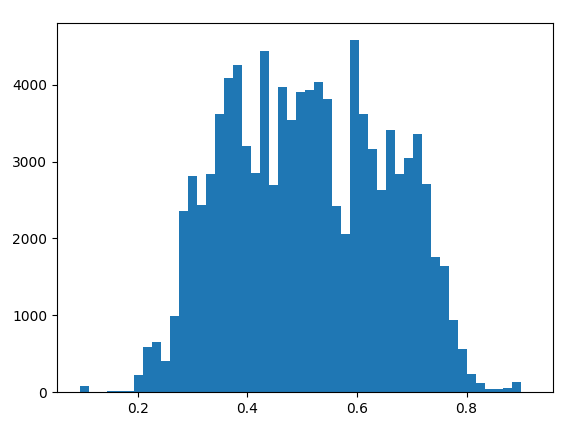
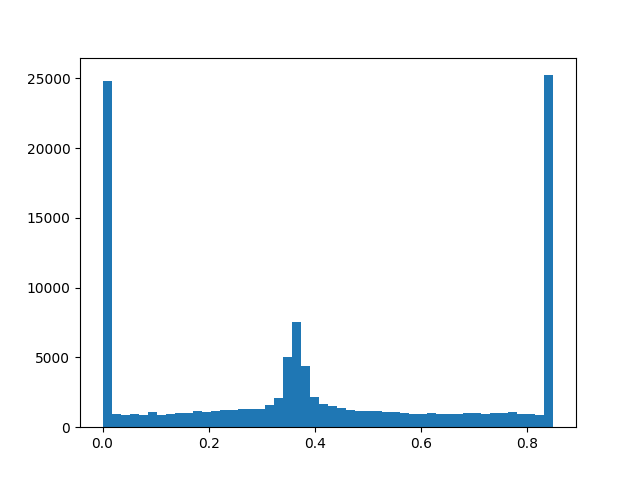
We balanced our data the best way possible, obtaining the next data distribution.
And once we had the data, we were going to train and analyze the model configurations and its behaviour.
Understanding the model
To understand the model, we tried different configurations to a balanced dataset. The configurations went from seeing the effects of the normalization and dropout techniques on the learning process to testing wether to predict only the steering, or the steering and the throttle.
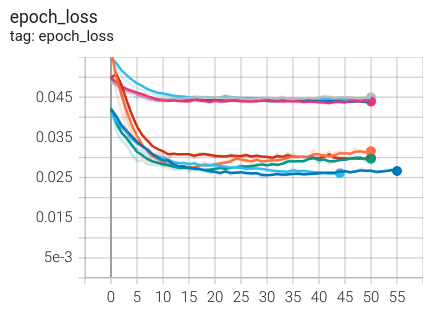
The worst learning cases from the epoch_loss graph belongs to the configurations in which we tried to make the model learn only the steering values, taking away the throttle. To add more to this graph, the orange line corresponds to the model we developed on week 19, a model that had a normalization layer between each convolutional layer. Now we know that this wasn’t strictly necessary, by bringing the model closer to the original concept of the PilotNet, we could obtain better results.
Now, on the good size of the graph, the lowest loss was given by a model that neither had normalization, nor dropout in it. Being the best for giving us a good loss value, it didn’t seem to perform well on extreme steering values. Now, trying to find the best possible configuration, the next good model was the one that had normalization on the input layer and dropout layers between the dense layer. This last model seemed to have a better correlation between the groundtruth and the prediction values even thought the loss was higher than the best model. Given this negligible difference between the losses, we decided to go on with the model that uses a normalization layer on the beginning and dropout layers between the dense layers.
A deeper understanding of why normalization worked when added on each layer or why the dropout is a good option in this case can be found on multiple articles and papers across the internet such as the BatchNormalization paper where they used the same concept of adding normalization on each layer. But this is going to need more time if I want to grasp and correlate some concepts to our problem.
Throttle analysis
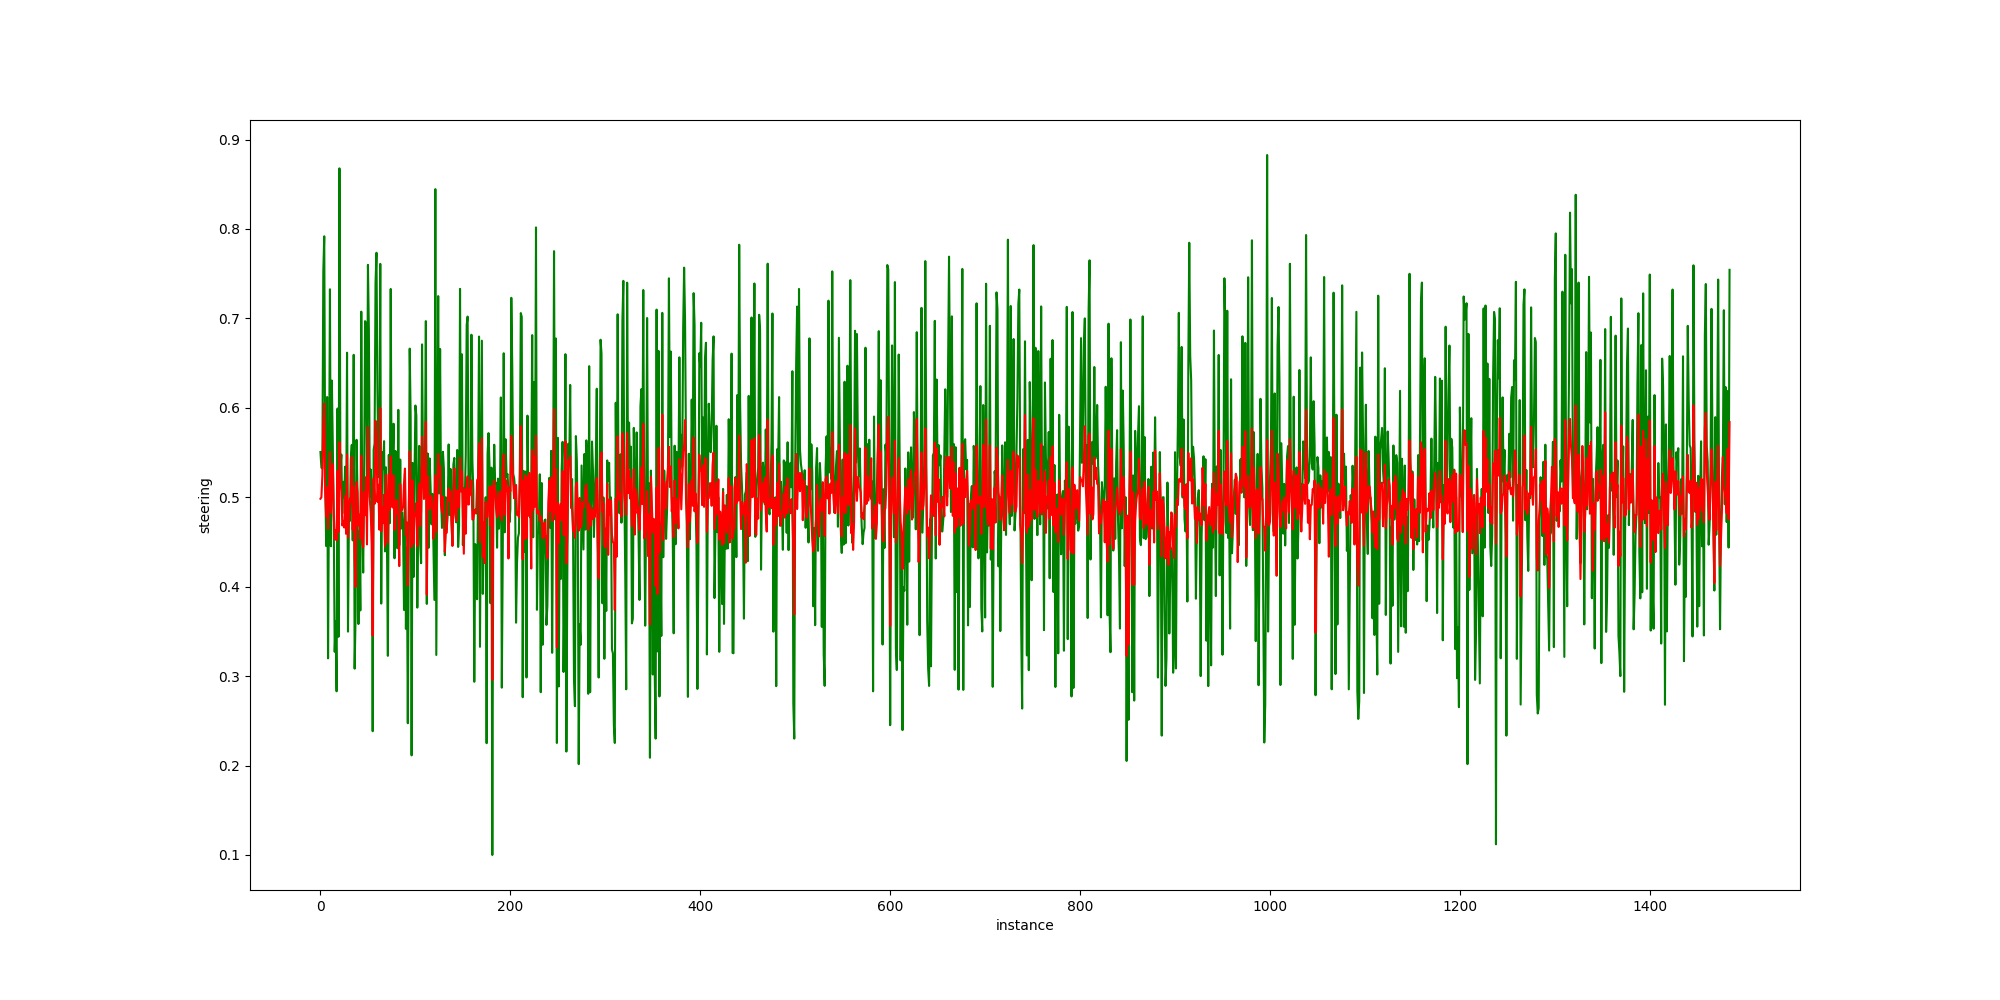
A good idea to analyze how the model is doing, would be to not only check how the steering is performing, but how the throttle is also doing on the training phases. To check the distribution of the throttle values, as we can see on the next figure, the throttle behaves by giving it higher values to accelerate, and decreasing it or making it zero to make the car go slower. By checking, we can see that the car accelerates and decelerate a lot, by following the speed signals set on the map. But how is our car going to know the speed limit if we crop the image to the point were the speed sign is not visible.
This question is one that we don’t need to solve right now, given the fact that we can focus on the steering by setting the throttle to a constant value. But we can check wether it predicts according to the expected behaviour.
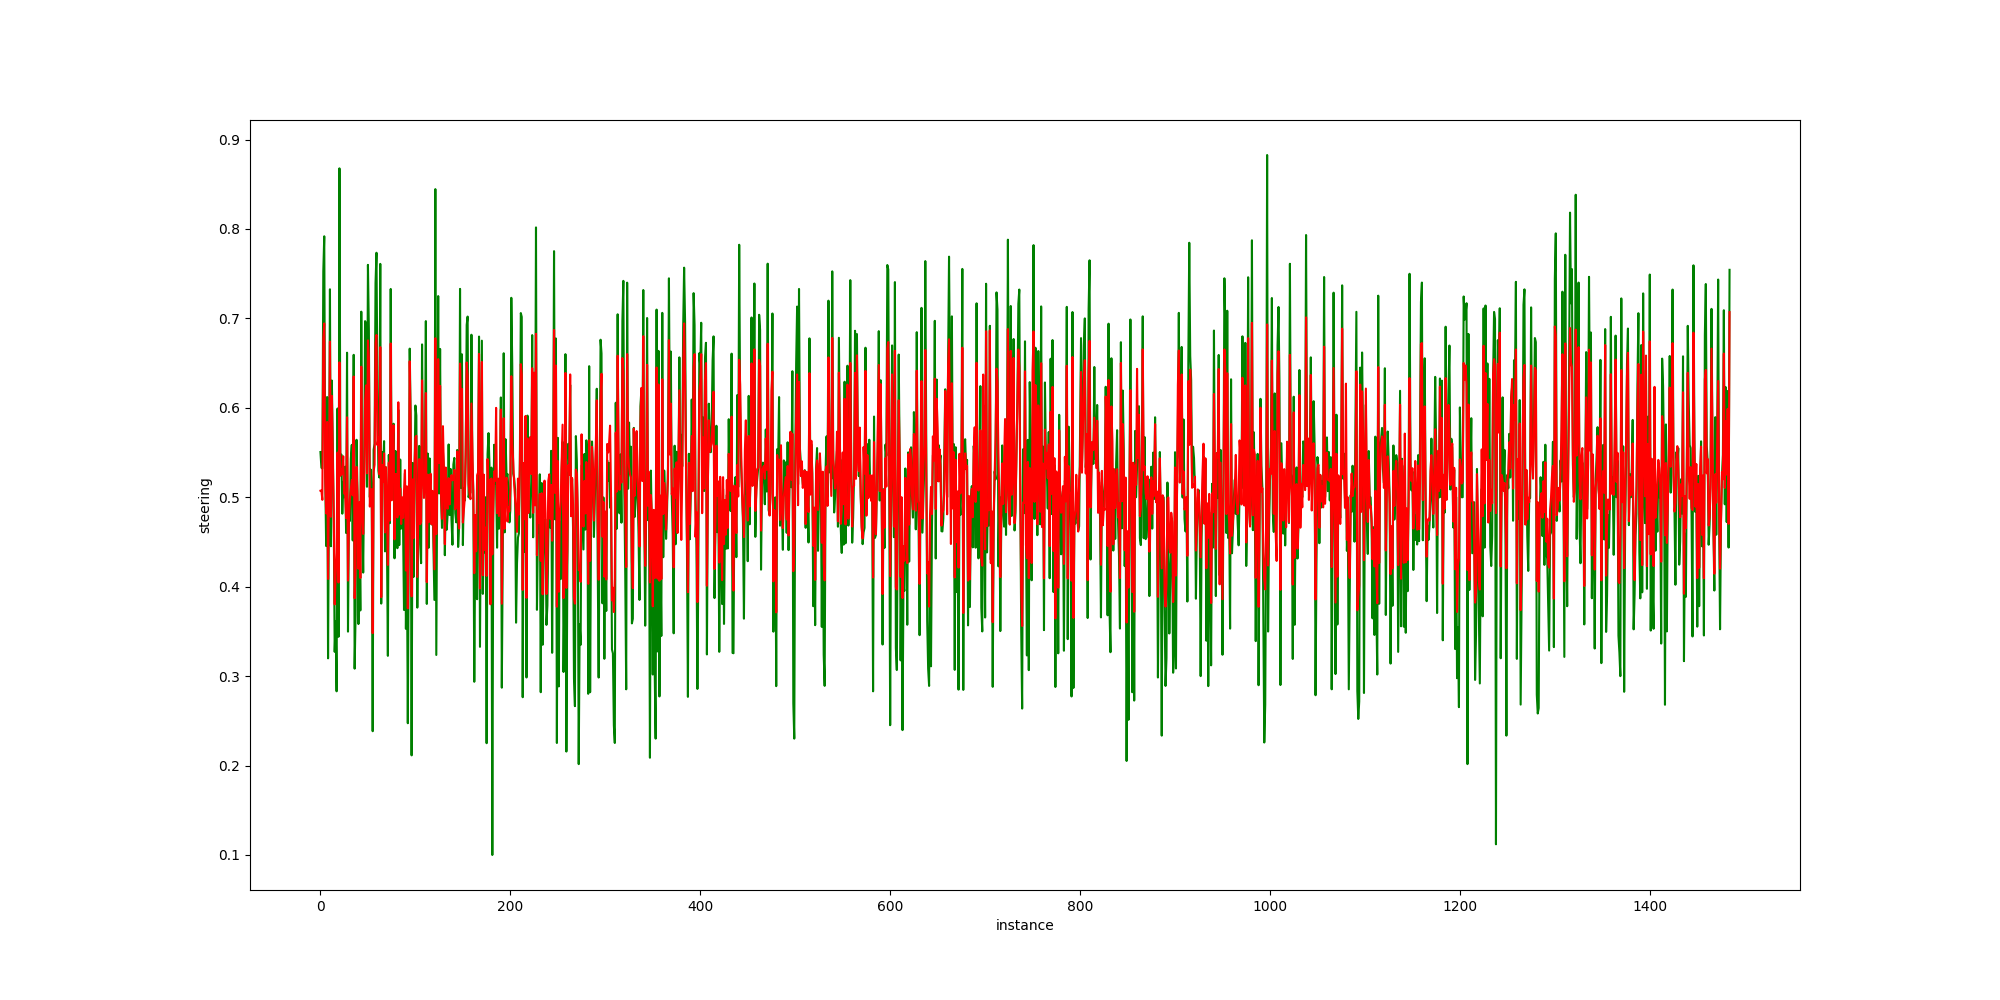
The previous plot shows us the groundtruth of the throttle against the predicted values, and as we can see, it oscilates a lot but we need to check if this translates to something meaningful on the simulator.