
Week 22 - Subjective vision for a follow-lane task
This week we will try to wrap up some major tasks for the follow-lane vehicle we have been developing this past weeks:
- First we will make some small improvements to the model to have a fairly good follow-lane car
- Secondly we will record an illustrative video to show how the car behaves in different roads, whether it be good or bad
- Thirdly, we are going to dig into the segmented images provided by the carla simulator
Improving little by little
By trying to improve the car, we aim to fix some minor behaviour problems that were somewhat bothersome. One interesting behaviour was that it veered to the right even though it had a continuous line separating the left lane from the right lane. A possible explanation to why it was doing this, was that we trained it over some data that we always recorded from the rightmost lane. This could be one of the main reasons to why the car will always change lanes to the farmost right lane (always asuming that there is enough space for the car to run over it).
In order to fix this behaviour we did a more thoughtful balancing of our data, with more augmentations and training time. Having all this steps covered we found a pretty good model that was able to stay in the lane most of the time. Some curious behaviour was found when the car steered too much on sharp curves, but this kind of behaviour were only sighted when the car velocity exceeded the appropiate speed for the curve.
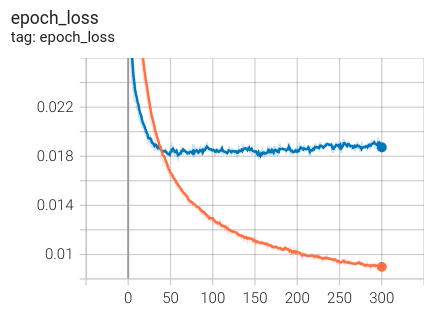
By taking a look into the next figure, we can always assume that 300 epochs is quite a lot, evenmore if all the previous training sessions we set the epochs to 50. It is quite clear that above 50 epochs, we were able to achieve a better model that could maintain itself, most of the time, on the road without changing lanes randomly. But given that the graph shows us a stabilized validation loss we could conclude that it would seem to be a little overkill to put 300 epochs, so we might be able to establish the epochs to around 150 without losing any performance.
Finally, we can take a look to the car behaviour along the training and the test maps. We can see that the car performs pretty well, staying most of the time in its lane.
Note: the car may oscillates in the video but this would be caused because we added a new sensor in order to have more visualizations to the car behaviour. But by adding a new sensor, the Carla Simulation is known to slow down the performance, needing a more powerful computer if we wanted to have this two or more sensors. This oscillation is not common when we use a single front camera sensor.
Image segmentation
Now, to further extend our research in this area, the next possible step was to try to use image segmentation. Knowing that the Carla Simulation offers us a simply way of using a semantic segmentation sensor that do all the work for us, we can easily extract images like the one we see in the next figure.
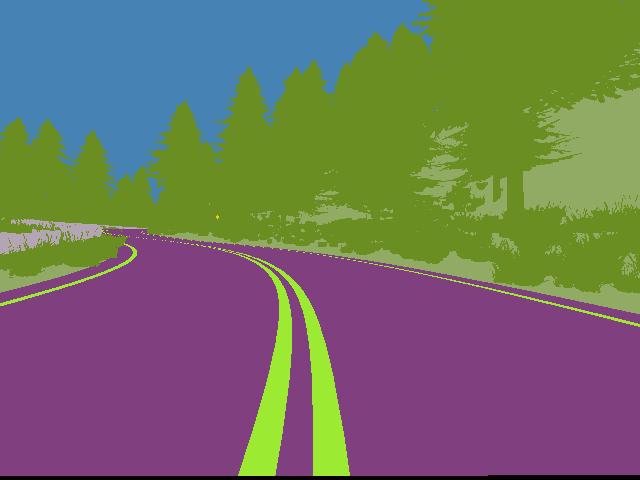
So, we need to replicate the same training and dataset recording process we did the last week to end with the same good results but using this time a segmentated image.